Concept
Implied Volatility
Implied Volatility, also known as IV rank/percentile, is a Breadth, Sentiment & External Data concept. The Library holds 1 implementation, a working definition you can pull into Quant.
Top Implied Volatility indicator
The top custom implementation, built on the original standard Implied Volatility formula.
1 total
Want to trade Implied Volatility? The implementation below is one prompt away from a backtested strategy in Quant.
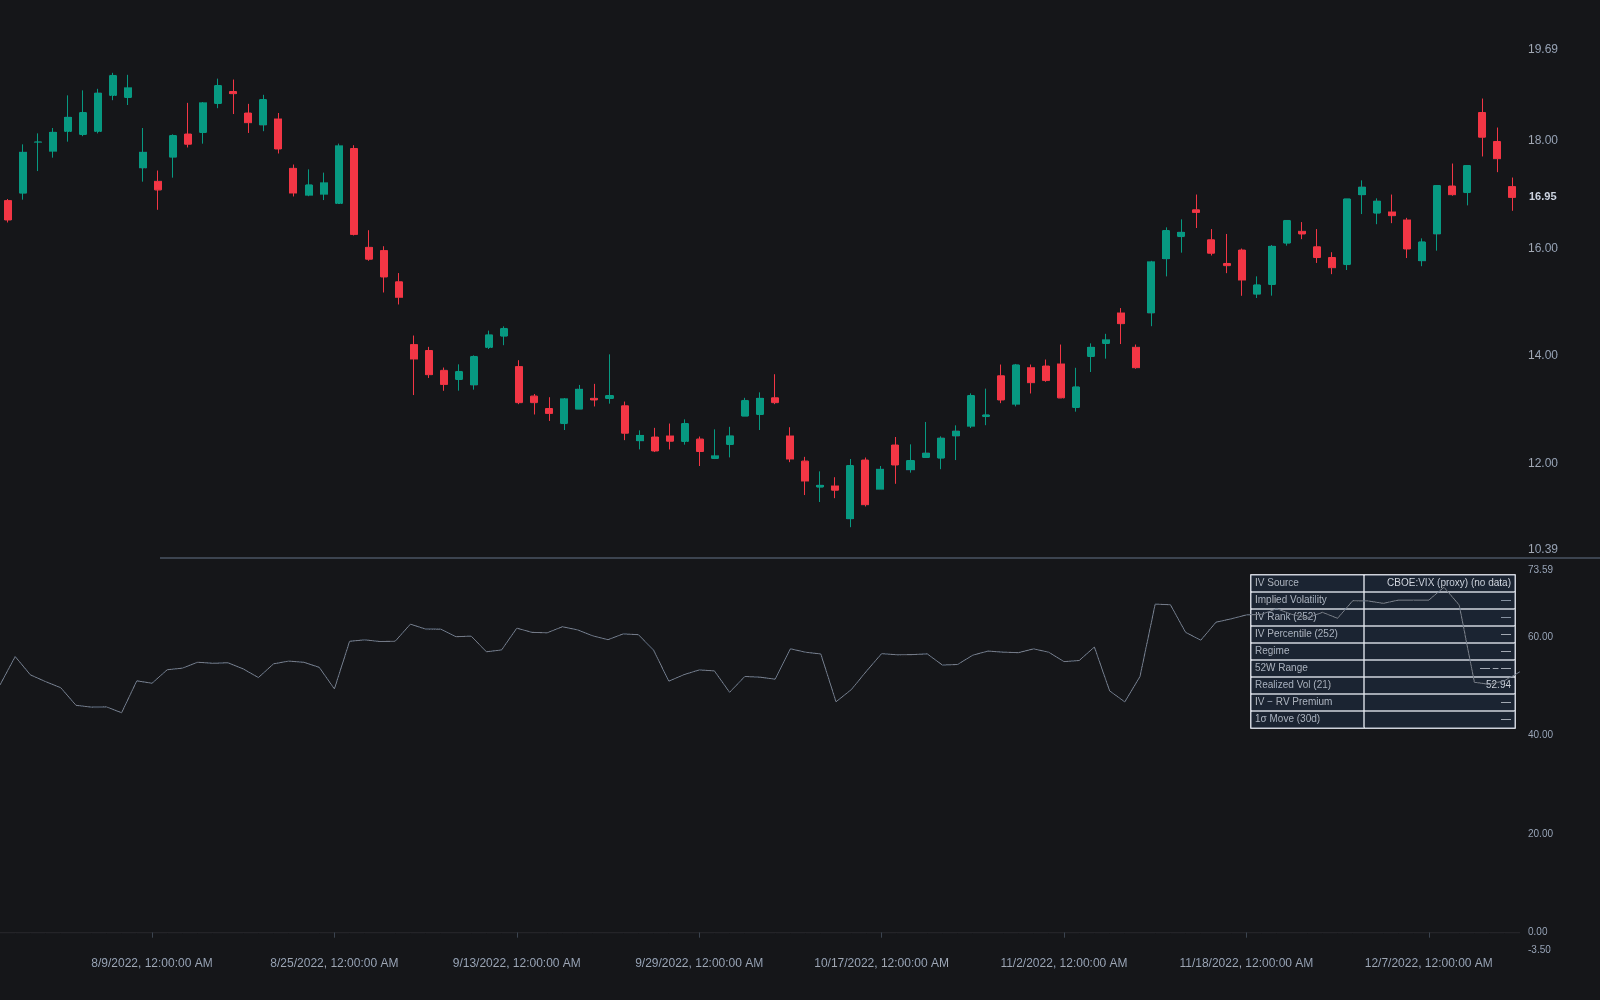
What is Implied Volatility?
Implied volatility (IV) is the volatility number that makes an option-pricing model's theoretical price match the option's actual market price. Where historical volatility measures how much price moved, IV is forward looking: it is the movement the options market is currently paying for, expressed as an annualized standard deviation (an IV of 25 prices roughly a 25% one-standard-deviation range over a year). IV is not one number per market: it varies by strike (the skew or smile) and by expiry (the volatility term structure), so a quoted figure is usually a summary such as 30-day at-the-money IV, or an index like the VIX.
Because raw IV levels differ wildly across instruments, traders normalize with IV rank and IV percentile. IV rank places today's IV inside its 52-week range: current minus the low, divided by the high minus the low. IV percentile is the share of lookback days on which IV was below today's value. Both answer the same question, whether volatility is rich or cheap relative to this market's own history. The context matters beyond options: the move the market is pricing scales directly with IV, so it informs stop distance, position size, and how much room a trade needs, even for traders who never touch an option.
How to calculate IV rank and IV percentile
Both start from a daily IV series for the underlying, typically 30-day at-the-money implied volatility.
- 1IV rank: subtract the 52-week IV low from the current IV, divide by the 52-week high minus the 52-week low, and multiply by 100. A rank of 80 means IV sits 80% of the way up its one-year range.
- 2IV percentile: count the lookback days with IV below today's value, divide by total days, and multiply by 100. A percentile of 80 means IV was lower on 80% of days.
- 3Read them differently: a single extreme spike inflates the range and compresses every later rank reading, while percentile is more robust to outliers. Quoting both avoids being fooled by either.
- 4Convert to an expected move when sizing: price times IV times the square root of days-to-horizon over 365 is a common approximation of the one-standard-deviation range being priced.
How it's calculated
Implied volatility is the annualized return volatility that makes an option pricing model reproduce the option's current market price.
No closed form exists, so solvers iterate with Newton-Raphson (stepping by vega) or bisection until the model price matches the market price.
Puts use the corresponding put formula; dividends, futures, and American exercise swap in Black-Scholes-Merton, Black-76, or binomial models.
IV Rank and IV Percentile normalize the current IV against its own one-year history so readings are comparable across symbols.
How traders use it
- As a volatility regime gauge for any strategy: high IV means the market is pricing wide ranges, arguing for wider stops, smaller size, and more patient targets; volatility-targeted sizing formalizes the adjustment.
- As a rich/cheap filter for option premium: sellers favor elevated rank or percentile and buyers favor depressed readings, with the standing caveat that expensive volatility can keep getting more expensive.
- As event context: IV ramps into earnings and scheduled macro event days, then collapses after the release (the volatility crush), so knowing where the ramp sits prevents mistaking pre-event premium for a durable regime change.
- As a spread against delivered movement: comparing IV with realized volatility shows the premium the market charges over what has actually occurred; a wide gap in either direction is information about hedging demand or complacency.
Implied Volatility vs related concepts
Realized Volatility: Realized volatility is measured from actual past returns; implied volatility is extracted from option prices and looks forward. The two co-move but routinely disagree, and the gap between them is itself a studied quantity.
VIX: The VIX is one standardized, published index of implied volatility: roughly 30-day IV for the S&P 500 computed from a strip of SPX options. Implied volatility is the general quantity that exists per option, strike, and expiry on any optionable market.
Volatility Percentile/rank: The percentile and rank technique applies to any volatility series, including ATR or realized volatility on markets without options. IV rank and IV percentile are the same normalization applied specifically to implied volatility.
Concept family
Breadth, Sentiment & External Data
63 concepts mapped · 63 in the Library
Implied Volatility FAQ
Turn Implied Volatility into a trading strategy.
Take the implementation from this page into Quant, then build on it, backtest it on real data, and keep refining it in conversation.