Inertial RSI
By LuxAlgoApr 3, 2026
The Inertial RSI is a momentum trading indicator designed to make the classic Relative Strength Index easier to read in live markets. Instead of relying on a fixed RSI period and then masking noise with heavy smoothing, it uses a dynamic optimization process to preserve directional momentum while reducing the choppy, back-and-forth behavior that often makes traditional oscillators harder to trade. The result is a smoother RSI-style trading indicator that can help traders spot trend strength, momentum shifts, and overbought or oversold conditions with more clarity.
How to Trade the Inertial RSI Trading Indicator
The Inertial RSI can be used much like a traditional RSI trading strategy, but its behavior is more stable and less reactive to small price fluctuations. This makes it especially useful for traders who want cleaner momentum signals without adding too much lag.
Because the indicator is designed to resist random market noise, it can help traders stay focused on the broader move instead of reacting to every minor oscillator twitch. In trending conditions, that often means fewer false reversals and better confidence when momentum remains strong.
What Makes the Inertial RSI Different?
Most RSI indicators use one fixed lookback length. That works, but it can also make the oscillator overly sensitive in some conditions and too sluggish in others. The Inertial RSI solves this by dynamically selecting the lookback length that produces the most stable reading from one bar to the next.
This “Forced Persistence” behavior gives the indicator an inertial quality. In simple terms, it prefers continuity unless price action creates a meaningful enough change to justify a shift in the RSI calculation. That makes it a powerful momentum indicator for traders who want smoother trend confirmation and cleaner reversal analysis.
Using the Inertial RSI for Momentum Analysis
When the Inertial RSI holds above the 50 centerline, it suggests bullish momentum is in control. When it remains below 50, it suggests bearish momentum is dominant. Since the line is less noisy than a standard RSI, these centerline conditions can be easier to trust in both swing trading and intraday trading.
The indicator also remains useful for identifying overbought and oversold behavior. While traders may still use common RSI reference levels like 70 and 30, the real advantage here is the smoother transition into and out of these zones. That can help traders distinguish true momentum extremes from random short-term fluctuations.
Signal Line Crossovers and Trend Changes
The dotted signal line adds another layer of confirmation. Traders can use RSI/signal line crossovers to spot local momentum shifts:
- RSI crossing above the signal line: Can suggest improving bullish momentum
- RSI crossing below the signal line: Can suggest weakening momentum or growing bearish pressure
- RSI above 50 with bullish crossover: Often supports trend continuation
- RSI below 50 with bearish crossover: Often supports bearish continuation
Like any trading indicator, these signals work best when combined with market structure, support and resistance, or trend analysis rather than used in isolation.
Why Forced Persistence Matters in This RSI Strategy
Traditional oscillator smoothing usually comes from moving averages added after the core calculation. While that does reduce noise, it often introduces more lag. The Inertial RSI approaches the problem differently by smoothing the source of the signal itself.
Forced Persistence Explained Simply
The indicator evaluates multiple RSI lookback lengths on every bar and selects the one that creates the smallest deviation from the previous final RSI value. Instead of forcing the oscillator to jump around based on a single fixed setting, it chooses the version of RSI that best preserves the current momentum state.
That means the oscillator can:
- Stay stable during strong trends
- Avoid excessive sawtooth behavior
- Transition more smoothly during reversals
- Reduce false momentum shifts caused by short-term noise
This makes the Inertial RSI a strong choice for traders searching for a more advanced RSI trading tool that still feels familiar and intuitive.
How to Read the Inertial RSI
Inertial RSI Line
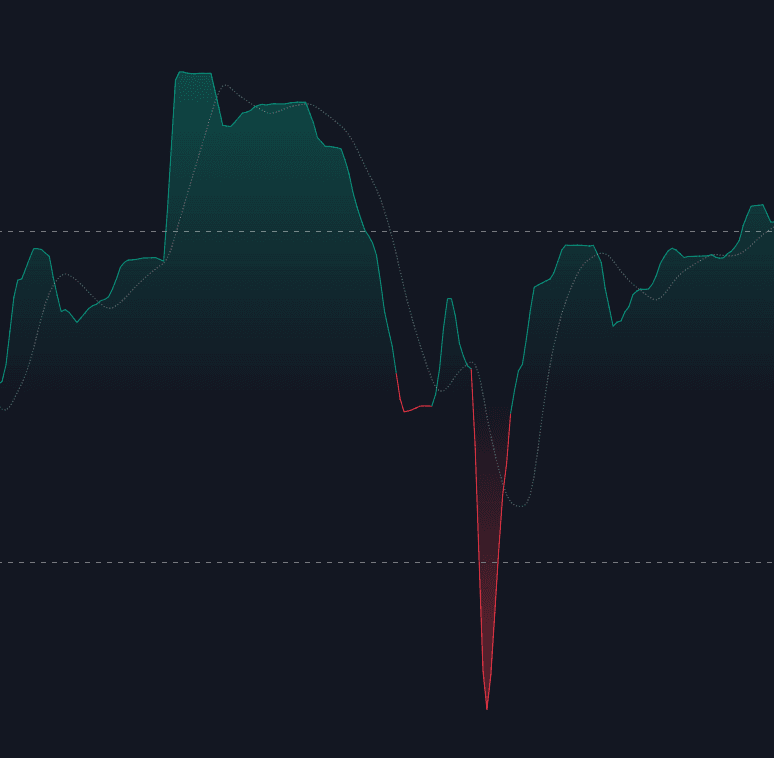
The solid line is the main oscillator and represents the smoothed RSI output. It changes color depending on whether momentum is bullish or bearish relative to the 50 level.
A sustained move above 50 usually reflects stronger buying pressure, while a sustained move below 50 reflects stronger selling pressure. Because the line is designed to be smoother, these conditions can be more visually obvious than with a standard RSI indicator.
Signal Line
The dotted line is a secondary moving average of the Inertial RSI. It can help traders identify short-term momentum turns, potential crossover entries, or fading trend strength.
This line is particularly useful for traders building an RSI crossover trading strategy or looking for extra confirmation before acting on a momentum shift.
Gradient Momentum Zones
The filled area between the RSI line and the 50 centerline visually emphasizes whether bullish or bearish momentum is dominant. This makes the indicator easier to scan quickly, especially for traders who want a strong visual cue for market direction.
The Calculation Behind the Inertial RSI Indicator
The core engine of the script is an optimization loop that runs on each bar. Rather than locking the RSI to a single period, the algorithm evaluates every integer length within the user-defined range between Minimum Length and Maximum Length.
For each candidate length, it calculates a raw RSI using an RMA-based method aligned with Wilder’s RSI logic. It then compares that candidate RSI value to the previous final Inertial RSI reading and measures the absolute difference.
The selected result is the one that minimizes that difference:
Best RSI = min(|Current Candidate(N) - Previous Final RSI|)
This is what gives the indicator its inertial behavior. It actively searches for the RSI length that best preserves continuity while still allowing the oscillator to adapt when price action truly shifts. For traders, this means a momentum oscillator that can stay responsive to meaningful moves while filtering out low-quality noise.
Inertial RSI Settings Explained
Core Settings
- Minimum Length: The shortest RSI lookback length the indicator can test during optimization.
- Maximum Length: The longest RSI lookback length available to the optimization loop.
- RSI Smoothing: Applies a final SMA smoothing layer to the inertial RSI output for a cleaner visual line.
- Signal Line Length: Controls the SMA length used to build the dotted signal line.
A wider range between minimum and maximum lengths generally allows the indicator to adapt more broadly across market conditions, though it can also increase processing load.
Visual Settings
- Show Gradient Fill: Turns the momentum fill between the RSI and 50 centerline on or off.
- Bullish Color: Sets the color used when momentum is above the 50 level.
- Bearish Color: Sets the color used when momentum is below the 50 level.
When to Use the Inertial RSI in a Trading Strategy
The Inertial RSI can fit into many types of trading strategies, including:
- Trend-following trading strategies: Use the 50 centerline and signal line to confirm direction
- Momentum trading strategies: Look for persistent strength or weakness and crossover confirmation
- Mean reversion trading setups: Watch for smooth entries into overbought or oversold territory
- Swing trading and day trading: Use the reduced noise to avoid reacting to minor fluctuations
This trading indicator is especially useful for traders who like RSI-based analysis but want a more refined and readable version for real market conditions.
FAQ
What is the Inertial RSI?
The Inertial RSI is an advanced RSI trading indicator that dynamically changes its lookback period to reduce noise and improve momentum clarity. It is designed to behave like a smoother, more stable Relative Strength Index without the heavy lag of traditional post-smoothing methods.
How is the Inertial RSI different from a normal RSI?
A normal RSI uses one fixed lookback period. The Inertial RSI tests a range of lookback values on every bar and chooses the one that changes the least from the previous output. This creates a smoother momentum oscillator with better trend coherence.
Is the Inertial RSI good for trend trading?
Yes. The Inertial RSI can be very effective for trend trading because it holds momentum states more cleanly, especially around the 50 centerline. That can make bullish and bearish conditions easier to interpret.
Can I use the Inertial RSI for overbought and oversold signals?
Yes. It still functions as an RSI-style oscillator, so traders can use it to identify overbought and oversold conditions. The main difference is that transitions into those zones are generally smoother and less noisy.
How do you access Inertial RSI?
You can get access on the LuxAlgo Library for charting platforms like TradingView, MetaTrader (MT4/MT5), and NinjaTrader for free.
Free indicator
Get free access to this indicator on the platforms below.
The Library is free. Quant makes it yours.
Pull any concept or indicator into Quant: rebuild it, retune it, or turn it into a backtested strategy of your own.