All indicators

Inertial Stochastic

By LuxAlgoMar 27, 2026

Static chart image
Oscillators

The Inertial Stochastic is a momentum trading indicator built to solve one of the biggest problems with a standard stochastic oscillator: noise. Instead of relying on heavy smoothing that adds lag, this tool uses a unique forced-persistence process to keep the oscillator stable at the source of the calculation itself. The result is a smoother, cleaner stochastic trading indicator that stays aligned with market momentum, makes overbought and oversold conditions easier to read, and helps traders hold trends with more confidence instead of reacting to every small fluctuation.

How to Trade the Inertial Stochastic Indicator

The Inertial Stochastic can be used like a classic stochastic oscillator, but its behavior is noticeably cleaner and more trend-friendly. Because the signal is designed to resist random price noise, traders can use it to spot momentum shifts, trend continuation, and exhaustion zones with less of the erratic movement that often causes false reads.

This makes it useful for traders who want a stochastic trading strategy that feels more stable in live conditions, especially in trending markets where traditional oscillators often whip up and down too aggressively.

What Makes Forced Persistence Different?

Most stochastic indicators smooth the signal after the calculation is already done. That usually means adding moving averages or signal filters on top, which can reduce noise but also delay signals. The Inertial Stochastic takes a different route.

With Forced Persistence, the indicator dynamically chooses the lookback period that keeps the current oscillator value as close as possible to the previous bar’s final reading. In simple terms, it is constantly selecting the version of the stochastic that preserves the most continuity from one bar to the next.

That means the smoothing happens before the final output becomes noisy, not after the fact. This is what gives the indicator its “inertial” feel. It tends to remain steady during strong directional moves, while still adjusting when price truly shifts enough to justify a change in momentum.

How to Read the Inertial Stochastic

The indicator includes a few simple components that make the momentum picture easier to understand:

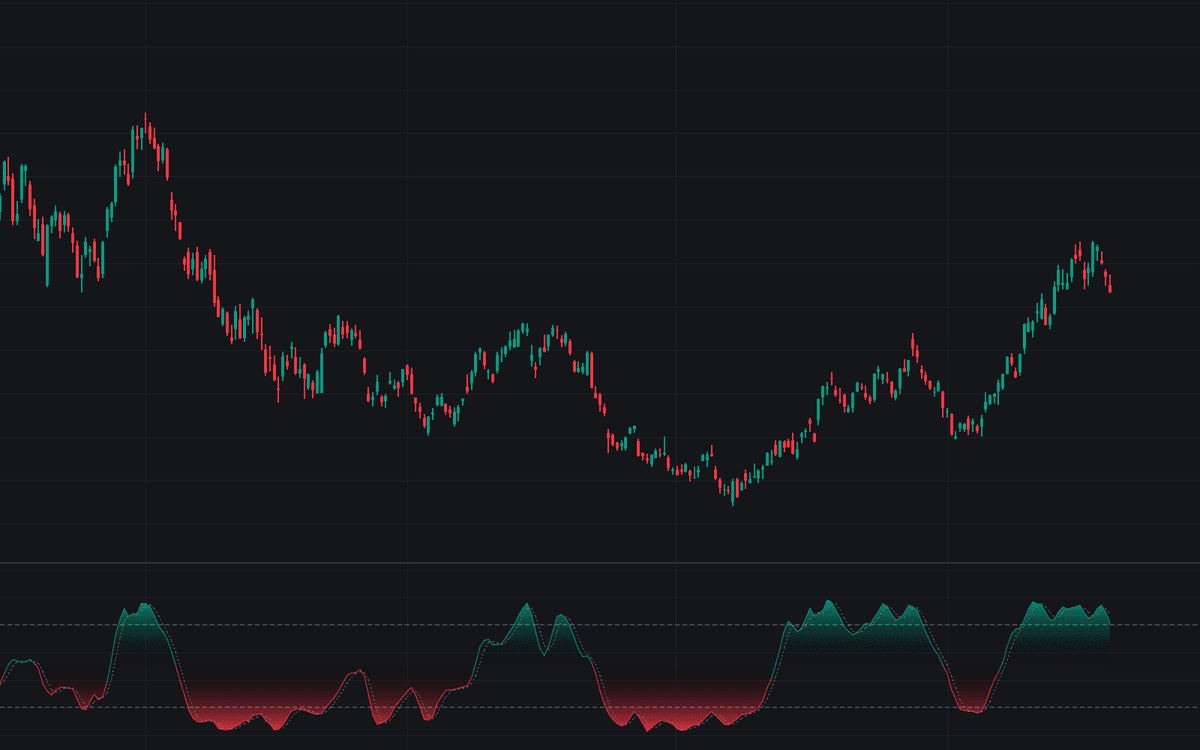
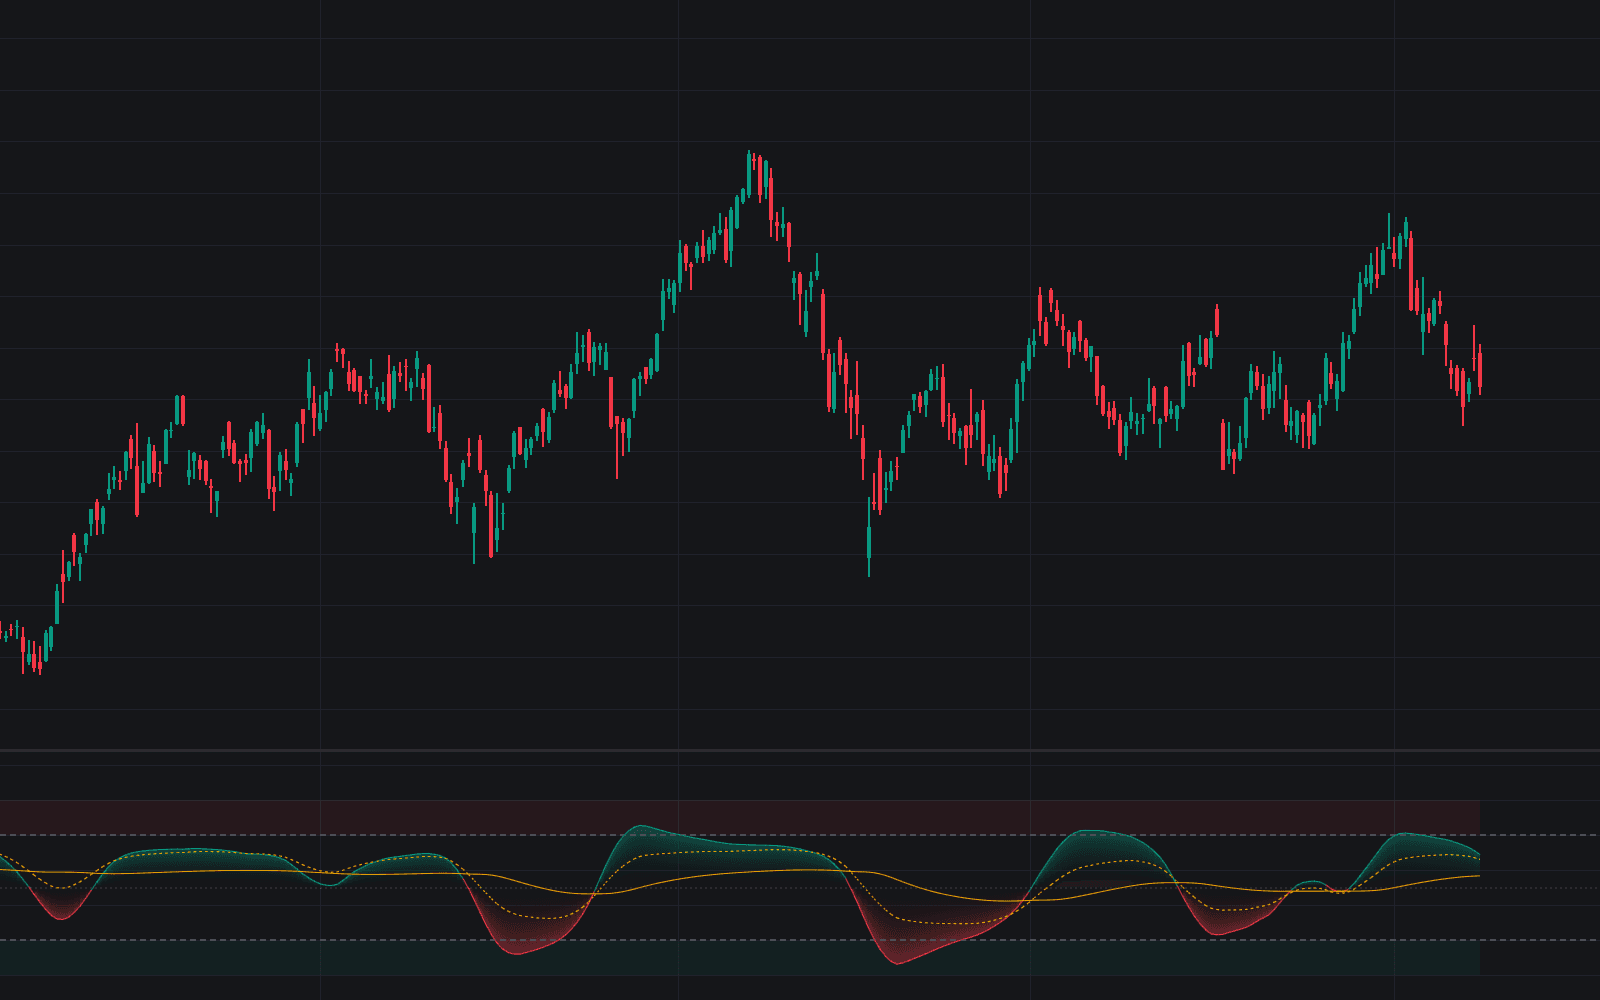
  • K Line (Solid): The main inertial stochastic line. This is the primary momentum reading and the line traders will focus on most.
  • D Line (Dotted): A smoothed signal line derived from the K line. It can help identify short-term crossover opportunities.
  • Centerline and Fill Zones: The area between the K line and the 50 level is filled with a gradient to show whether momentum is leaning bullish or bearish, and how strong that directional pressure is.

When the K line holds above 50, momentum is generally bullish. When it stays below 50, momentum is generally bearish. Because the line is less jittery than a standard stochastic, these shifts can be easier to trust.

Using It for Overbought and Oversold Conditions

Like other stochastic oscillator tools, the Inertial Stochastic can help identify overbought and oversold regions. The difference is that it often reaches and holds these areas with more structure.

In a strong uptrend, the oscillator may remain elevated rather than constantly snapping back down. In a strong downtrend, it may stay depressed for longer. That behavior can be valuable because it helps traders avoid treating every extreme reading as an automatic reversal signal.

A better way to use this trading indicator is to combine extreme zones with context:

  • Overbought readings in an uptrend can confirm trend strength.
  • Oversold readings in a downtrend can confirm bearish continuation.
  • Reversals become more meaningful when the oscillator exits an extreme and also shifts relative to the centerline or D line.

Using Crossovers and Momentum Shifts

Crossovers between the K and D lines can still be used, but they tend to carry more value when aligned with the broader trend.

For example:

  • A bullish crossover above the 50 line may support a continuation setup in an uptrend.
  • A bearish crossover below the 50 line may support trend continuation to the downside.
  • Crossovers against the larger momentum bias may be weaker unless they happen alongside a clear structural reversal in price.

This makes the tool useful not just as an overbought/oversold oscillator, but also as a momentum confirmation indicator for broader trading strategy decisions.

Why This Trading Indicator Is Smoother Without Heavy Lag

A common frustration with oscillator-based trading indicators is that smoothing often comes at the cost of responsiveness. The more you smooth, the more delayed the signal becomes. The Inertial Stochastic is designed to reduce that tradeoff.

By dynamically optimizing the lookback period on every bar, it does not need to depend as heavily on long smoothing filters to produce a readable signal. That gives traders a cleaner view of trend persistence and momentum transitions without the same degree of group delay found in many traditional smoothed oscillators.

For traders searching for a low-noise momentum indicator, a smoother stochastic oscillator, or a more readable trend oscillator for TradingView and other charting platforms, this is a strong alternative to conventional stochastic setups.

How the Inertial Stochastic Works

At the core of the script is a bar-by-bar optimization process. Instead of using one fixed stochastic length, the indicator evaluates every possible integer lookback within the user-defined range.

For each candidate length, it calculates a raw stochastic value and compares that value to the previous bar’s final result. The algorithm then chooses the lookback period that produces the smallest change.

Best Stoch = min(|Current Candidate(N) - Previous Final Stoch|)

This means the final value is not simply the output of a fixed-length stochastic. It is the output of the stochastic length that best preserves continuity from the last bar.

That continuity is what creates the inertial effect. The oscillator tends to ignore minor fluctuations that do not materially change the market’s internal momentum structure, while remaining capable of adapting when a more meaningful price shift occurs.

Why Dynamic Length Selection Matters

This adaptive behavior is what separates the Inertial Stochastic from a standard stochastic trading indicator.

A fixed-length stochastic can become too sensitive in choppy markets and too jumpy in strong trends. By contrast, the Inertial Stochastic lets the lookback period shift as needed within your defined range. This gives the oscillator flexibility while preserving a stable signal path.

In practice, that can help traders:

  • Reduce whipsaws from minor price movement
  • Stay in trends longer
  • Read momentum structure more clearly
  • Distinguish between real reversals and ordinary noise

Inertial Stochastic Settings Explained

Core Settings

  • Minimum Length: The shortest stochastic lookback the algorithm is allowed to test. Lower values can make the indicator more reactive.
  • Maximum Length: The longest lookback period the algorithm can consider. A larger range increases adaptability and inertia, though it also raises computational load.
  • K Smoothing: Applies a final SMA smoothing to the chosen inertial stochastic value for a cleaner main line.
  • D Smoothing: Controls the SMA used to generate the signal line from the K line.

These settings allow traders to tune the balance between responsiveness and smoothness based on their market and timeframe.

Visual Settings

  • Bullish Color: Sets the K line and gradient fill appearance when the oscillator is above the 50 centerline.
  • Bearish Color: Sets the K line and gradient fill appearance when the oscillator is below the 50 centerline.

Who Is This Indicator Best For?

The Inertial Stochastic can be useful for many styles of traders, including:

  • Trend Traders: Helps confirm momentum direction without getting shaken out by small pullbacks.
  • Swing Traders: Makes it easier to spot cleaner momentum turns and continuation phases.
  • Intraday Traders: Can reduce visual noise and improve decision-making in fast-moving conditions.
  • Mean Reversion Traders: Offers overbought and oversold signals that may be more readable when combined with price structure.

Because it works as both a momentum oscillator and a trend-confirmation tool, it can fit into a wide range of trading strategies.

FAQ

What is the Inertial Stochastic indicator?

The Inertial Stochastic is a stochastic-based momentum trading indicator that uses forced persistence to smooth the oscillator by dynamically selecting the most stable lookback period on every bar. It is designed to reduce noise while preserving trend clarity.

How is it different from a standard stochastic oscillator?

A standard stochastic uses a fixed lookback period and often requires extra smoothing filters that add lag. The Inertial Stochastic adapts its lookback dynamically, which helps create a smoother signal without relying as heavily on delayed filtering.

Is the Inertial Stochastic good for trend trading?

Yes. One of its biggest strengths is that it can remain more stable during directional moves, making it useful for traders who want to follow momentum without reacting to every minor fluctuation.

Can I use it for overbought and oversold signals?

Yes, but it is most effective when those signals are interpreted in context. Strong trends can keep the oscillator in extreme zones for longer, so traders often get better results by combining extremes with centerline behavior, crossovers, and price action.

How do I access the Inertial Stochastic?

You can get access on the LuxAlgo Library for charting platforms like TradingView, MetaTrader (MT4/MT5), and NinjaTrader for free.

Free indicator

Get free access to this indicator on the platforms below.

TradingView
NinjaTrader
MetaTrader 4/5

Unlock the entire LuxAlgo Library

Every indicator, every strategy, full charts, and complete access to Quant — our AI agent.