Intraday Intensity
 By LuxAlgoApr 28, 2026
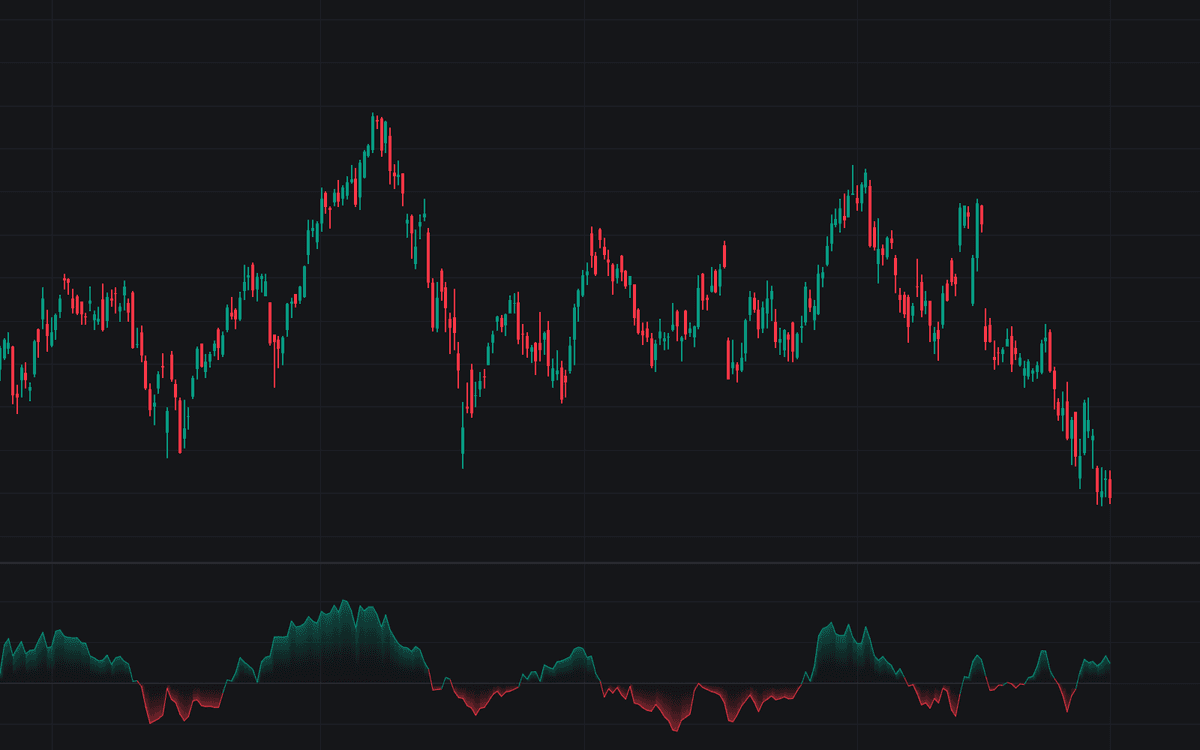

Intraday Intensity scales each bar's volume by the close's position within the bar (+1 at the high, −1 at the low, 0 at mid-range) to approximate institutional pressure into the close. This build ships both published forms of Intraday Intensity: the normalized II% oscillator, a rolling intensity sum over a rolling volume sum that oscillates around zero, and the original open-ended cumulative line, read by slope against price.
How to Trade the Intraday Intensity?
- II% above zero: bars keep closing near their highs on volume, the accumulation side; sustained readings beat single prints.
- II% below zero: the distribution side; zero-line crossings alert both ways.
- Bullish divergence: a lower low in price against a higher intensity low, quiet-accumulation evidence, never a standalone signal.
- Cumulative mode: rising reads accumulation, falling distribution. The slope carries the information, not the level.
Like the rest of the volume and order-flow studies, it infers pressure rather than measuring executed flow; only movement inside each bar counts, so gaps contribute nothing.
Intraday Intensity Settings
- Display (default Normalized Oscillator (II%)): the bounded oscillator or the original cumulative line.
- Oscillator Length (default 21): window of the rolling sums in the normalized form; no effect on the cumulative line.
- Mark Divergences (default disabled): draws the pivot-to-pivot comparisons; detection always runs and feeds the divergence alerts either way.
- Pivot Lookback (default 5): bars each side to confirm a swing; divergences confirm with that delay and do not repaint.
- Max Bars Between Swings (default 60): the furthest apart two compared swings may sit.
- Gradient Fill (default enabled): applies to the oscillator form only; colors round out the style group.
Frequently Asked Questions

Original indicatorBuilt in-house by LuxAlgo
The Library is free. Quant makes it yours.
Pull any concept or indicator into Quant: rebuild it, retune it, or turn it into a backtested strategy of your own.