Concept
Intraday Intensity
Intraday Intensity is a Volume & Order Flow concept. The Library holds 1 implementation, a working definition you can pull into Quant.
Bollinger
Top Intraday Intensity indicator
The top custom implementation, built on the original standard Intraday Intensity formula.
1 total
The Intraday Intensity implementation below can become a backtested trading strategy — describe your rules and Quant writes the code.
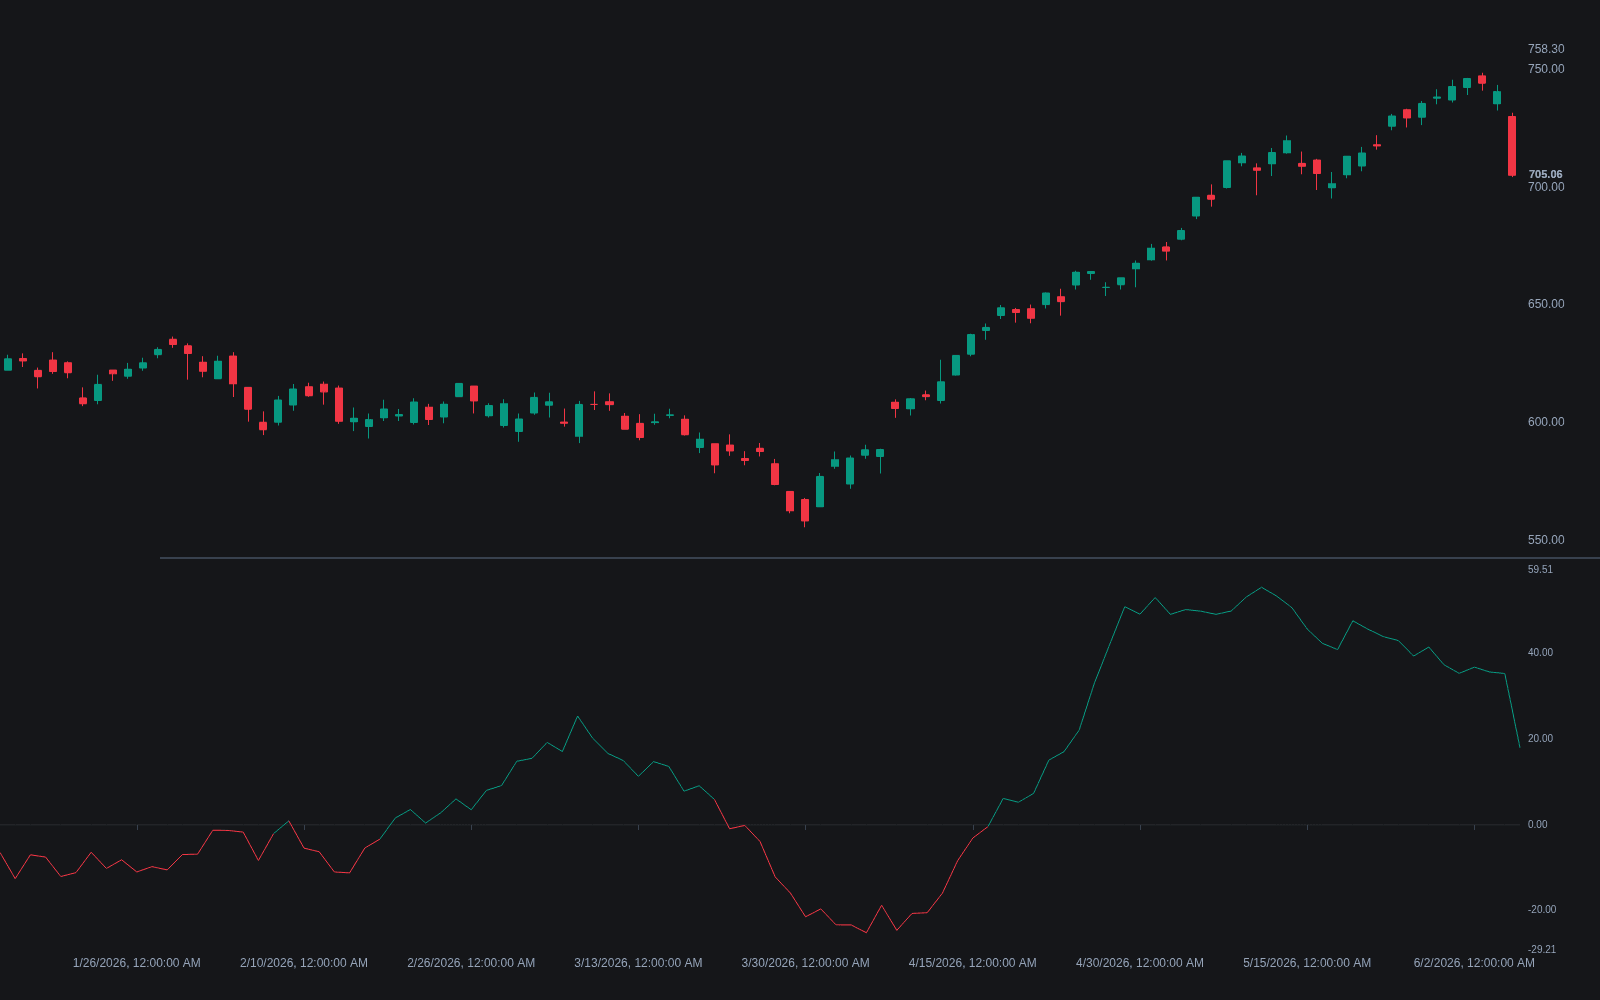
What is Intraday Intensity?
Intraday Intensity is a volume-pressure gauge developed by David Bostian and popularized by John Bollinger. Each bar's volume is weighted by where the close sits in the range: the multiplier is (2 × close - high - low) / (high - low), which is +1 for a close at the high, -1 at the low, and 0 at mid-range. The premise is that institutions completing large orders push price toward one extreme of the bar by the close, so close location times volume approximates their footprint.
Bostian designed the measure when a bar's high, low, close, and volume were all the data an analyst had, aiming to infer institutional accumulation from bar shape alone. John Bollinger later gave it wide circulation, discussing it in Bollinger on Bollinger Bands among the volume tools he relies on, in his preferred normalized form. That endorsement largely explains why it now most often appears alongside band-based mean-reversion work rather than as a standalone study.
The weighted values are used two ways. Summed cumulatively they form a running line with the same per-bar formula as the Accumulation/Distribution Line, so the two coincide. Normalized, a rolling sum of Intraday Intensity is divided by the rolling sum of volume (commonly 21 bars) to give a bounded percentage oscillator, the form Bollinger favors. Rising readings suggest accumulation, falling readings distribution, and neither is a standalone signal.
The design has clear boundaries. Close-location weighting reads pressure from where the bar finishes, so it ignores gaps entirely; a session that gaps down hard but closes near its high still prints a positive value. Bars where high equals low leave the multiplier undefined and are typically zeroed. And because pressure is inferred from bar shape rather than measured from executed trades, the reading approximates order flow rather than recording it, the gap separating it from modern volume delta tools built on bid/ask data.
How to read Intraday Intensity on a chart
The study plots in a subpanel in one of two forms, and the form decides how it is read.
- 1Note the form: the cumulative line is open-ended and read by slope against price; the normalized version oscillates around zero, commonly over 21 bars.
- 2On the normalized form, read the zero line: sustained positive values mean closes keep finishing high in their ranges on volume, sustained negative values the reverse.
- 3Compare direction with price: agreement confirms the move, while a fresh price high without a fresh intensity high is a volume divergence worth flagging.
- 4Qualify with participation: intensity computed on thin trade means little, so check that relative volume is normal or better before trusting a reading.
- 5Anchor to location: readings taken at a value area edge or a session VWAP retest say more than the same readings printed mid-range.
How traders use it
- As confirmation at Bollinger Band tags: a lower-band touch while normalized intensity is positive or rising flags a reversion candidate, while a tag confirmed by heavy negative intensity argues the move has real supply behind it.
- As a trend audit: a cumulative line rising with price supports the advance, while a flat or falling line during a rally warns that closes keep drifting away from the highs on volume.
- As an accumulation screen in ranges: persistently positive intensity while price goes sideways is read as quiet buying, the same job OBV does but weighted by close location within the bar rather than by close-to-close direction.
- As a divergence audit at extremes: new price highs while normalized intensity steps down imply rallies closing nearer mid-range, with the mirrored read at successive lows.
- Cross-referenced with profile structure: persistent positive intensity as price holds above the point of control suggests acceptance, heavy negative intensity as the level is lost suggests initiative selling.
Intraday Intensity vs related volume tools
OBV: OBV adds or subtracts a bar's entire volume based only on whether the close rose or fell, so gaps count and bar shape does not. Intraday Intensity grades each bar continuously by close location within its range and ignores gaps. They answer the same accumulation question from complementary inputs.
Money Flow Index: MFI weights volume by typical price and direction across bars, then normalizes into a 0-100 RSI-style oscillator with overbought and oversold bands. Intraday Intensity works within the bar, asking where the close sat in the range, and its normalized form centers on zero rather than fixed extremes.
Volume Delta: Delta measures actual aggressor volume, trades lifting the offer minus trades hitting the bid, so it records order flow directly but requires intrabar data. Intraday Intensity approximates the same pressure from ordinary OHLCV bars, coarser but computable on any chart.
Concept family
Volume & Order Flow
88 concepts mapped · 88 in the Library
Intraday Intensity FAQ
Turn Intraday Intensity into a trading strategy.
Take the implementation from this page into Quant, then build on it, backtest it on real data, and keep refining it in conversation.