Intraday Momentum Index
 By LuxAlgoMay 14, 2026
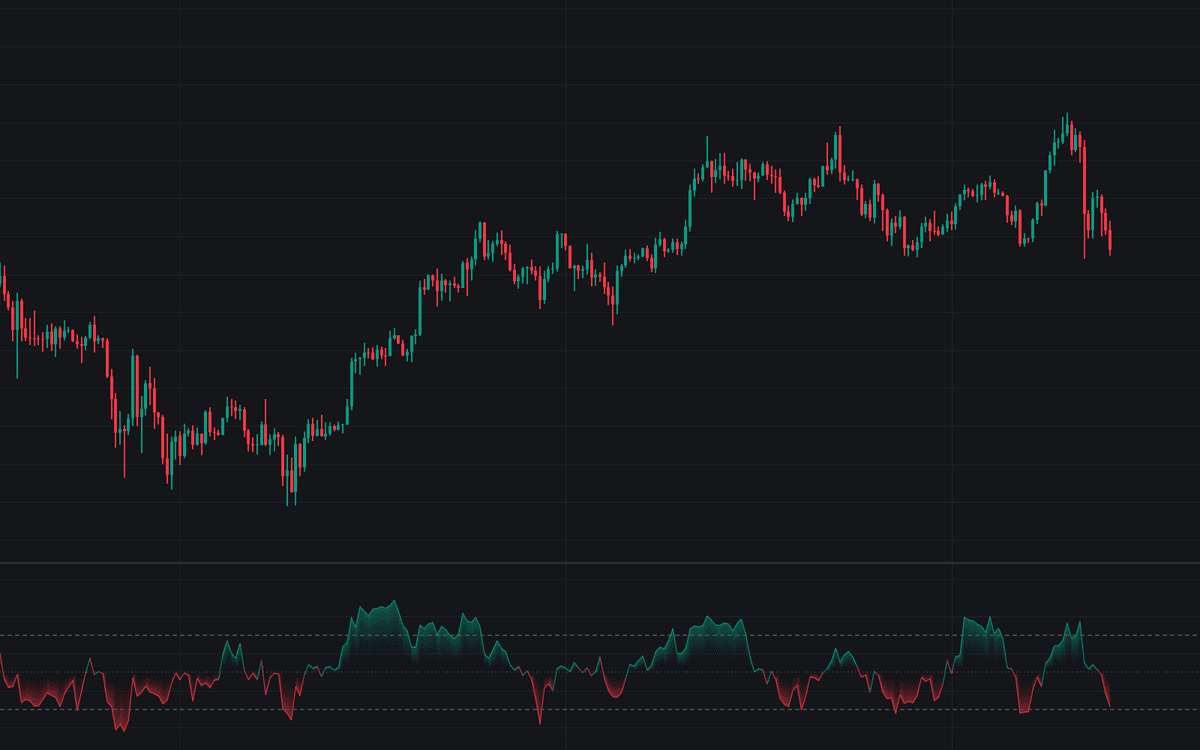

Intraday Momentum Index runs RSI arithmetic on candle bodies: bullish bodies stand in for gains, bearish bodies for losses, and the up-body total prints as a percentage of all body movement over the window. The result is the Intraday Momentum Index on a 0–100 scale (candlestick sentiment in oscillator form) drawn with dashed overbought and oversold levels, a dotted 50 midline, and a gradient fill that flips color with whichever side of the midline is in control.
How to Trade the Intraday Momentum Index?
- Above the Overbought level: sessions have persistently closed above their opens; many traders act only on the curl back through the band, not the touch itself.
- Below the Oversold level: the mirrored read: persistent selling into the close, with the cross back above the band as the classic exit trigger.
- Midline crosses: crossing 50 marks the balance of bodies shifting between buyers and sellers, and both directions carry alerts.
- Distance from 50: how lopsided recent sessions have been, a persistence read, not an automatic reversal call.
Because only open-to-close movement enters the sums, gaps contribute nothing: a market that gaps higher but keeps closing under its opens reads bearish here while a close-to-close oscillator reads bullish.
Intraday Momentum Index Settings
- Length (default 14): lookback for the body sums, borrowed from RSI convention; shorter windows react faster but whipsaw more.
- Overbought (default 70): the upper band; some traders widen it to 80 on volatile symbols.
- Oversold (default 30): the lower band, widened to 20 by the same logic.
- Gradient Fill (default enabled) plus the bullish, bearish, and level colors make up the style group.
Frequently Asked Questions

The Library is free. Quant makes it yours.
Pull any concept or indicator into Quant: rebuild it, retune it, or turn it into a backtested strategy of your own.