Concept
Intraday Momentum Index
Intraday Momentum Index is a Momentum & Oscillators concept. The Library holds 1 implementation, a working definition you can pull into Quant.
IMI
Top Intraday Momentum Index indicator
The top custom implementation, built on the original standard Intraday Momentum Index formula.
1 total
The Intraday Momentum Index implementation below can become a backtested trading strategy — describe your rules and Quant writes the code.
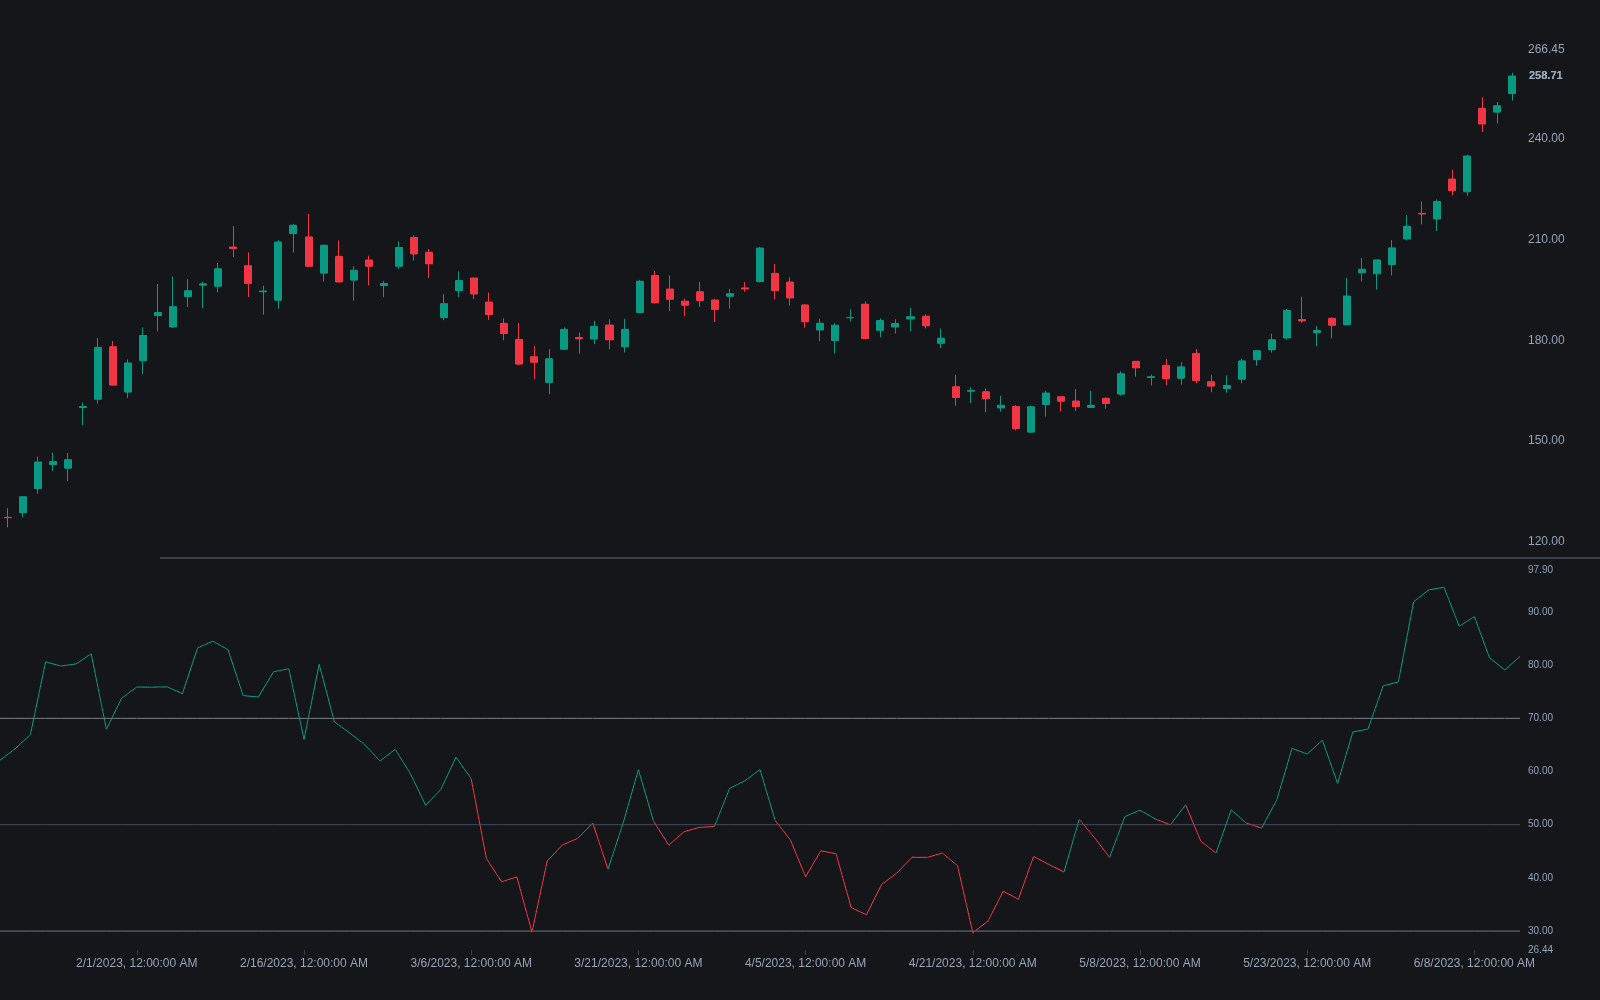
What is the Intraday Momentum Index?
The Intraday Momentum Index (IMI) is an RSI-style oscillator computed on candle bodies instead of close-to-close changes. Introduced by Tushar Chande, it sums the bodies of up candles (close above open) and of down candles (close below open) over a lookback, commonly 14 bars, and expresses the up-body total as a percentage of all body movement. The result runs from 0 to 100 and is read with familiar overbought/oversold bands, often 70 and 30.
Chande presented the IMI in The New Technical Trader (1994), written with Stanley Kroll. His observation was that classic momentum tools discard the information candlestick readers care about most, the relationship between each bar's open and close, and that RSI's arithmetic could digest that information directly. The IMI is best understood as a translation layer: candlestick sentiment, expressed in oscillator form so it can be thresholded, screened, and compared like any other bounded study.
The 'intraday' in the name refers to movement inside each bar, from its open to its close, not to intraday timeframes; the calculation works identically on daily or weekly charts. The design imports candlestick logic: a market that keeps closing above its opens is being bought during the session, whatever the overnight gaps contribute. That is exactly where IMI's read diverges from standard RSI, which counts gaps as part of each day's change.
The arithmetic follows the RSI template, with close-minus-open substituted for close-to-close change: up-bar bodies play the role of gains, down-bar bodies the role of losses, and the output is the up-body sum as a percentage of total body movement over the window. A reading of 50 means bullish and bearish bodies balanced; distance from 50 measures how one-sided sessions have been. Like any bounded oscillator it can pin near an extreme in a strong trend, so elevated readings describe persistence rather than an automatic reversal.
How to read the Intraday Momentum Index
IMI plots in a subpanel on a 0-100 scale, and the routine matches RSI with one extra check for gaps.
- 1Apply the common 14-period setting and mark the 70 and 30 bands; some traders widen to 80/20 on volatile symbols.
- 2Treat band entries as conditions rather than triggers: above 70 the market keeps closing over its opens, and most practitioners wait for the reading to curl back through the band before fading it.
- 3Run the gap check: compare IMI with standard RSI on the same chart. When RSI is stretched but IMI is not, gaps rather than intrabar buying are carrying the move.
- 4Scan swing points for divergence against price, including hidden divergence in trends, exactly as with other bounded oscillators.
- 5In strong trends, downgrade the bands and read the 50 midline as the bias line: sustained readings above it mark buyer-controlled sessions, below it seller-controlled ones.
How it's calculated
An RSI-style oscillator built from intrabar open-to-close moves, bounded between 0 and 100.
Introduced by Tushar Chande; read like RSI, with 70 commonly treated as overbought and 30 as oversold.
Because it uses each bar's open-to-close body, gaps between bars never enter the calculation.
Bars that close exactly at their open add nothing to either sum.
How traders use it
- As a candle-body overbought/oversold gauge: readings above roughly 70 mark stretches where sessions keep closing above their opens, readings below 30 the reverse, with most traders waiting for the reading to curl back before fading it.
- As a gap filter on RSI: when RSI is elevated mainly because of overnight gaps while IMI stays modest, the intrabar auction is not confirming the strength, and the reverse when IMI leads.
- As a divergence source, comparing IMI's swing highs and lows against price the same way other bounded oscillators are used.
- As a mean-reversion timer in ranges: IMI extremes printed at range edges time fades better than the same readings in trends, often cross-checked against a stochastic oscillator for agreement.
- As a bias filter: the 50 midline separates buying-dominant from selling-dominant stretches, a simpler read than band touches and useful when pairing IMI with trend tools such as MACD.
Intraday Momentum Index vs related oscillators
RSI: Same 0-to-100 scale and similar bands, different raw input. RSI uses close-to-close change, so gaps count toward momentum; IMI uses close-minus-open bodies, so only intrabar movement counts. In gap-heavy markets the two can disagree meaningfully.
Stochastic Oscillator: The stochastic locates the latest close within the recent high-low range, so it measures where price sits; IMI measures how sessions traveled from open to close, so it measures how price got there. A stochastic can read overbought from position alone, while IMI needs persistently bullish bodies.
Stochastic Momentum Index: The SMI refines the stochastic by measuring the close against the midpoint of the high-low range, double-smoothed and centered on zero. Like IMI it cares where price finishes, but it works from range midpoints over a window rather than summing individual open-to-close bodies.
Concept family
Momentum & Oscillators
91 concepts mapped · 91 in the Library
Intraday Momentum Index FAQ
Turn Intraday Momentum Index into a trading strategy.
Take the implementation from this page into Quant, then build on it, backtest it on real data, and keep refining it in conversation.