Inverse Fisher Transform
 By LuxAlgoJun 18, 2026
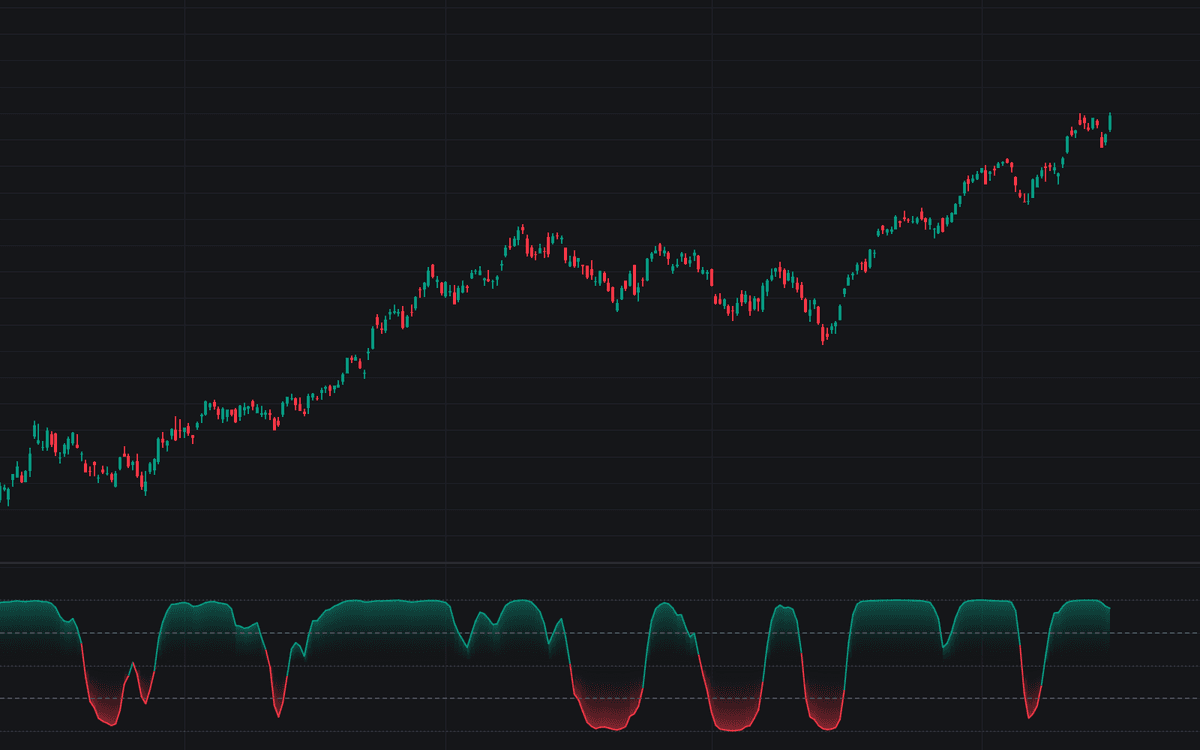

Inverse Fisher Transform compresses a smoothed, scaled oscillator through Ehlers' S-curve so it pins near +1 or −1 and crosses the middle quickly. This build applies the inverse Fisher transform to a selectable base (a 5-period RSI by default, with Stochastic, SMI, and CCI alternatives) scales it by 0.1, smooths it with a 9-period weighted moving average, and plots the result against ±0.5 thresholds and ±1 rails.
How to Trade the Inverse Fisher Transform?
- Cross up through the Lower Threshold: the conventional buy trigger, the output leaving the lower saturated zone.
- Cross down through the Upper Threshold: the conventional sell or exit trigger.
- Crossings into the outer zones: a cross through +0.5 or −0.5 outward commits the output to a rail, a regime label, not a fade.
- Time at a rail: extended saturation reads as trend persistence; between thresholds the tool is deliberately brief.
All four events carry alerts. Trigger markers are off by default, the alerts fire regardless.
Inverse Fisher Transform Settings
- Base Oscillator (default RSI): the input fed to the transform; every base is centered before scaling.
- Length (default 5): base-oscillator lookback, short enough to actually visit the extremes.
- Source (default close): the series feeding the base.
- SMI Smoothing (default 3): double-EMA smoothing for the SMI base only.
- Scale Factor (default 0.1): how often the rails are reached. Larger saturates sooner, smaller lingers in the middle.
- Smoothing Length (default 9): weighted average applied before the transform; 1 disables it.
- Upper Threshold (default 0.5) and Lower Threshold (default -0.5): the trigger boundaries.
- Gradient Fill (default enabled), Trigger Markers (default disabled), and the colors are style options.
Frequently Asked Questions

Original indicatorBuilt in-house by LuxAlgo
The Library is free. Quant makes it yours.
Pull any concept or indicator into Quant: rebuild it, retune it, or turn it into a backtested strategy of your own.