


Island Reversal
Nov 5, 2025
The Island Reversal trading indicator helps traders spot one of the most reliable reversal patterns directly on their chart — the island reversal. This formation signals potential turning points in market trends, whether a bullish trend is about to shift bearish or a bearish trend is preparing to reverse upward. The indicator makes it easy to filter these setups by trend, volume, and range, offering flexibility to display only the most meaningful or pure island reversals.
How to Trade with the Island Reversal Trading Indicator
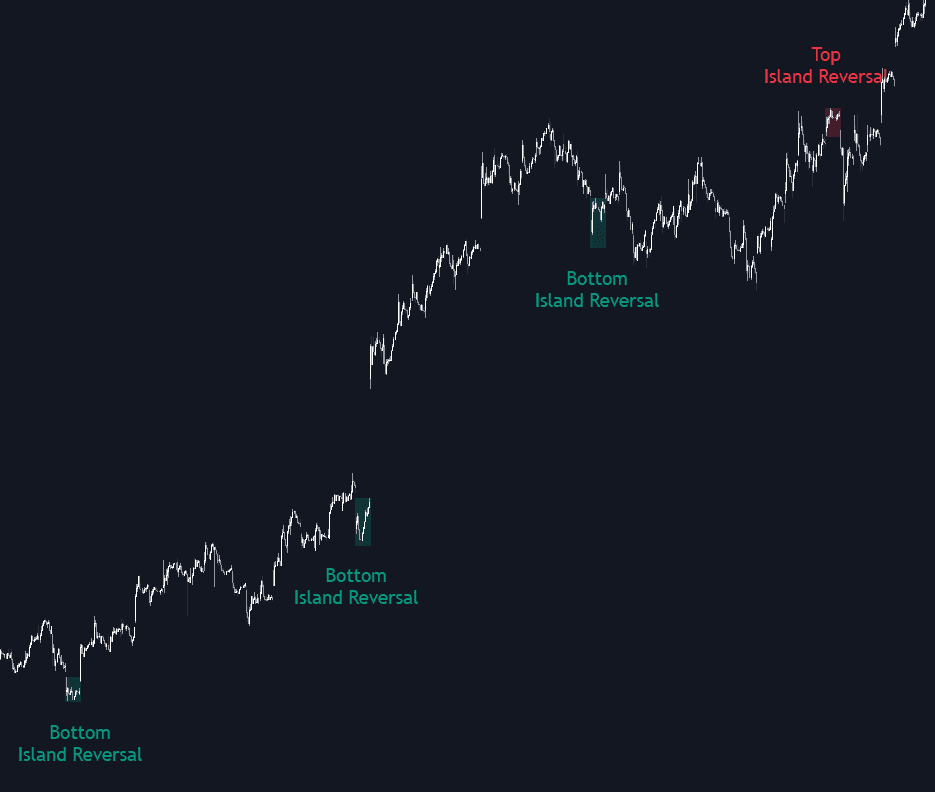
An island reversal pattern occurs when the market gaps in one direction, consolidates briefly, and then gaps in the opposite direction — effectively isolating a “price island” on the chart. This structure often highlights exhaustion in the current trend and the potential start of a new one.
For traders, island reversals can be used for market timing and trend change confirmation. Recognizing when these patterns develop and monitoring price behavior afterward can help identify strategic entry and exit zones.
Let’s break down the structure of a classic island reversal and how each part contributes to the overall setup.
Each pattern generally includes the following components:
- A strong preceding trend (bullish or bearish).
- A gap that signals the start of the pattern.
- A consolidation phase or trading range — the “island.”
- A second gap in the opposite direction, closing the pattern.
- The resulting trend reversal, often marking a significant turning point in price action.
For example, a bullish island reversal typically appears at the end of a downtrend, while a bearish island reversal forms near the top of an uptrend.
Using Trend, Volume, and Range Filters for Smarter Signals
The trend filter ensures higher-quality signals by detecting only top island reversals during uptrends and bottom island reversals during downtrends. You can fine-tune the detected trend size in the settings — larger trend lengths highlight more impactful reversals, while smaller ones capture shorter-term shifts.
The volume filter identifies reversal patterns only when the volume within the “island” exceeds the volume in the prior trend. This reflects a realistic market behavior where traders typically become more active near potential tops and bottoms.
Finally, the range filters allow traders to refine the price action within the pattern:
- Horizontality Filter (R²): Uses the R-squared statistic from linear regression to measure how sideways the price movement is during the island phase. Lower values indicate a flatter consolidation.
- Volatility Filter: Based on long-term volatility, it determines the size of the consolidation range. Higher values allow broader ranges, while smaller values restrict detection to tighter reversals.
These customizable filters help traders adapt the tool to different market conditions, timeframes, and trading styles — from short-term scalping to swing or position trading.
Indicator Settings
Trend Filter
- Trend Filter: Enable or disable the trend-based detection.
- Trend Length: Adjust how large the preceding trend must be to qualify.
Volume Filter
- Volume Filter: Enable or disable volume-based detection.
Range Filter
- Horizontality Filter (R²): Toggle on/off and set the threshold for sideways price movement.
- Volatility Filter: Toggle on/off and set the multiplier value to control how wide the pattern’s range can be.
Style
- Bullish: Choose your preferred color for bullish reversals.
- Bearish: Choose your preferred color for bearish reversals.
- Transparency: Adjust the visual opacity from 100 (fully transparent) to 0 (fully opaque).
FAQ
What is the Island Reversal trading indicator?
The Island Reversal indicator detects powerful reversal formations that can mark key turning points in market trends. It provides advanced filtering options to identify only high-quality setups based on volume, volatility, and trend context.
How can I trade using this indicator?
Look for island reversal signals near strong trend extremes. Confirm the setup using volume and trend filters, and consider using it alongside other LuxAlgo tools for confirmation, such as momentum or structure indicators.
How do I access the Island Reversal indicator?
You can get access to the Island Reversal trading indicator on the LuxAlgo Library, available for popular charting platforms like TradingView, MetaTrader (MT4/MT5), and NinjaTrader — completely free.
Trading & investing are risky and many will lose money in connection with trading and investing activities. All content on this site is not intended to, and should not be, construed as financial advice. Decisions to buy, sell, hold or trade in securities, commodities and other investments involve risk and are best made based on the advice of qualified financial professionals. Past performance does not guarantee future results.
Hypothetical or Simulated performance results have certain limitations. Unlike an actual performance record, simulated results do not represent actual trading. Also, since the trades have not been executed, the results may have under-or-over compensated for the impact, if any, of certain market factors, including, but not limited to, lack of liquidity. Simulated trading programs in general are designed with the benefit of hindsight, and are based on historical information. No representation is being made that any account will or is likely to achieve profit or losses similar to those shown.
Testimonials appearing on this website may not be representative of other clients or customers and is not a guarantee of future performance or success.
As a provider of technical analysis tools and strategies, we do not have access to the personal trading accounts or brokerage statements of our customers. As a result, we have no reason to believe our customers perform better or worse than traders as a whole based on any content, tool, or platform feature we provide.
Charts used on this site are by TradingView in which the majority of our technical indicators are built on. TradingView® is a registered trademark of TradingView, Inc. www.TradingView.com TradingView® has no affiliation with the owner, developer, or provider of the Services described herein.
Market data is provided by CBOE, CME Group, BarChart, Massive, CoinAPI. Select U.S. equities data is provided through Massive. CBOE BZX real-time U.S. equities data is licensed from CBOE and provided through BarChart. Real-time futures data is licensed from CME Group and provided through BarChart. Select cryptocurrency data, including major coins, is provided through CoinAPI. All data is provided “as is” and should be verified independently for trading purposes.
This does not represent our full Disclaimer. Please read our full disclaimer.
© 2026 LuxAlgo Global, LLC.