


Isotonic Regression
 by LuxAlgo · Feb 16, 2026
This allows the regression curve to render as a single continuous object instead of multiple segmented lines, improving chart performance and visual clarity.
Indicator Settings Explained
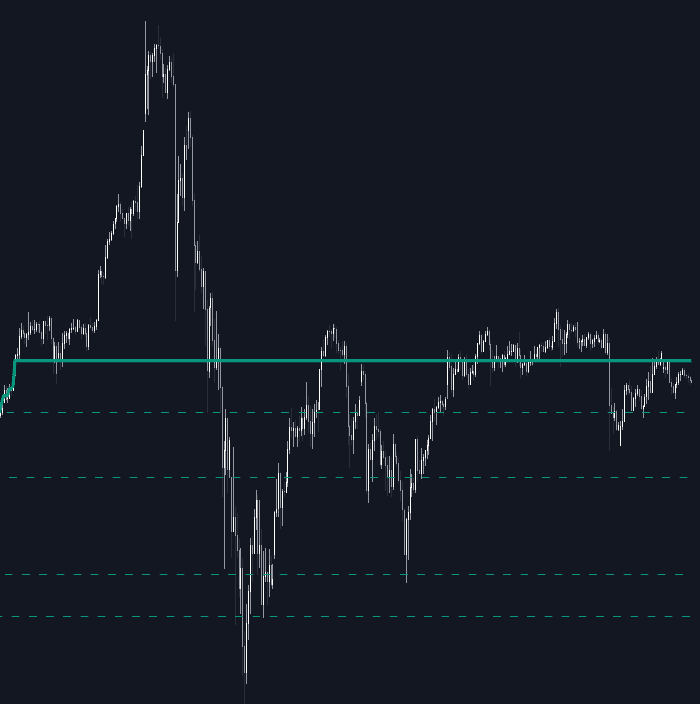
The Isotonic Regression indicator provides customizable parameters to align with different trading styles and timeframes.
- Lookback Length: Determines how many bars are included in the regression calculation. Shorter lengths increase responsiveness, while longer lengths provide stronger structural smoothing.
- Source: Defines which price input is used (Close by default, but can be Open, High, Low, or custom sources).
- Direction: Sets the monotonic constraint (Auto, Non-Decreasing, or Non-Increasing).
- Flat Period Threshold: Controls how many consecutive bars must form a plateau before an extension level is drawn.
These settings allow traders to adapt the tool for scalping, swing trading, or higher-timeframe structural analysis.
Style Customization
To integrate seamlessly into any chart layout, the indicator includes styling controls:
- Fit Bullish/Bearish: Custom colors for upward or downward regression fits.
- Fit Style/Width: Choose between Solid, Dashed, or Dotted lines and adjust thickness.
- Ext Bullish/Bearish: Colors for plateau extension levels.
- Ext Style/Width: Adjust the appearance and thickness of extension lines.
This ensures the trading indicator remains visually intuitive across different market conditions and chart themes.
Practical Trading Strategy Applications
The Isotonic Regression trading strategy framework can be applied in multiple ways:
- Trend Confirmation: Use Auto mode to confirm directional bias before entering trades.
- Pullback Entries: In a non-decreasing fit, wait for price retracements toward plateau levels.
- Breakout Trading: Enter when price decisively breaks an extended flat level.
- Market Structure Filtering: Combine with momentum oscillators or volume tools to confirm breakouts from regression plateaus.
Because it enforces structural direction, this indicator is particularly effective when combined with volatility filters, volume analysis, or higher-timeframe bias confirmation.
FAQ
Does the Isotonic Regression indicator repaint?
Yes. Because it calculates over a rolling historical lookback window, the regression line will adjust as new bars are added and older bars fall out of the window.
How is Isotonic Regression different from a moving average?
A moving average smooths price but allows both upward and downward fluctuations. Isotonic regression enforces a strict directional constraint, creating a structured staircase fit that better highlights trend persistence and consolidation zones.
What is the best lookback length to use?
Shorter lookbacks are more responsive but less stable. Longer lookbacks provide clearer structural trend identification. The optimal setting depends on your timeframe and trading strategy.
How do I access the Isotonic Regression indicator?
You can get access on the LuxAlgo Library for charting platforms like TradingView, MetaTrader (MT4/MT5), and NinjaTrader for free.
Unlock Unlimited Access to the LuxAlgo Library
Upgrade your plan to get all indicators, strategies, charts, and full access to Quant, our AI agent.
Trading & investing are risky and many will lose money in connection with trading and investing activities. All content on this site is not intended to, and should not be, construed as financial advice. Decisions to buy, sell, hold or trade in securities, commodities and other investments involve risk and are best made based on the advice of qualified financial professionals. Past performance does not guarantee future results.
Hypothetical or Simulated performance results have certain limitations. Unlike an actual performance record, simulated results do not represent actual trading. Also, since the trades have not been executed, the results may have under-or-over compensated for the impact, if any, of certain market factors, including, but not limited to, lack of liquidity. Simulated trading programs in general are designed with the benefit of hindsight, and are based on historical information. No representation is being made that any account will or is likely to achieve profit or losses similar to those shown.
Testimonials appearing on this website may not be representative of other clients or customers and is not a guarantee of future performance or success.
As a provider of technical analysis tools and strategies, we do not have access to the personal trading accounts or brokerage statements of our customers. As a result, we have no reason to believe our customers perform better or worse than traders as a whole based on any content, tool, or platform feature we provide.
Charts used on this site are by TradingView in which the majority of our technical indicators are built on. TradingView® is a registered trademark of TradingView, Inc. www.TradingView.com TradingView® has no affiliation with the owner, developer, or provider of the Services described herein.
Market data is provided by CBOE, CME Group, BarChart, Massive, CoinAPI. Select U.S. equities data is provided through Massive. CBOE BZX real-time U.S. equities data is licensed from CBOE and provided through BarChart. Real-time futures data is licensed from CME Group and provided through BarChart. Select cryptocurrency data, including major coins, is provided through CoinAPI. All data is provided “as is” and should be verified independently for trading purposes.
This does not represent our full Disclaimer. Please read our full disclaimer.
© 2026 LuxAlgo Global, LLC.