Jump Detection
 By LuxAlgoJun 22, 2026
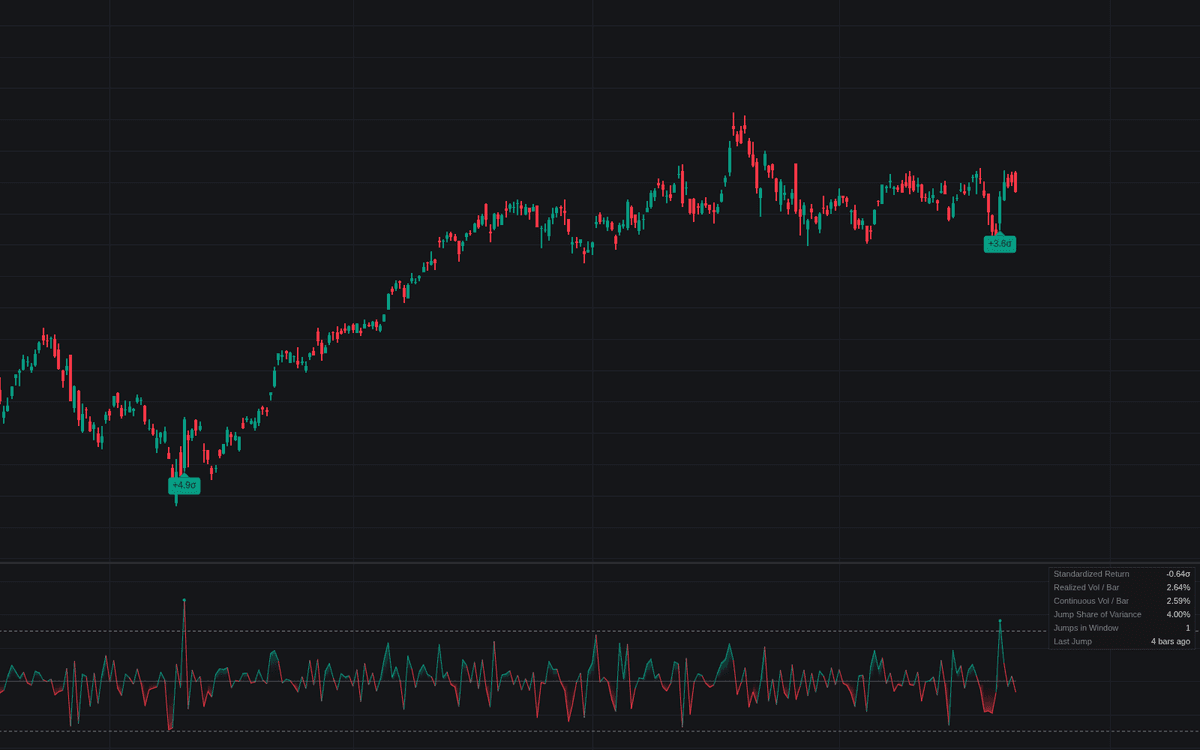

Jump Detection is the definitive clean build of jump detection for everyday charts: each bar's log return is divided by a robust estimate of ordinary volatility and plotted as a Standardized Return in sigma units against dashed lines at ±3σ. Bars clearing it print Jump Markers and optional price-chart labels, and a dashboard splits recent variance into continuous and jump-driven parts.
How to Trade the Jump Detection?
- Reading beyond ±3σ: the bar repriced beyond what its trailing benchmark calls ordinary - volatility estimates, band tags and stops spanning it deserve separate treatment.
- Gap Jump alert: the open itself repriced beyond the threshold from the prior close, so price skipped the levels between - where a stop could not have filled.
- Jump Share of Variance climbing: the dashboard shows variance arriving in lurches rather than steady churn.
An isolated dislocation stands out sharply while a sustained stretch of large bars lifts the benchmark and stops being flagged. Four alerts cover up, down, either-direction and gap jumps - useful pause triggers for the volatility toolkit.
Jump Detection Settings
- Volatility Lookback (default 20): trailing bars behind the benchmark, ending on the prior bar so the tested bar never inflates its own yardstick.
- Volatility Estimator (default Bipower Variation): the robust scale for standardizing; Median Absolute Deviation and Standard Deviation are the alternatives.
- Jump Threshold (σ) (default 3): sigma multiple a return must exceed; raise toward 4-5 on noisy intraday data.
- Mark Jumps on Chart (default on): labels jumps on the price chart with magnitudes.
- Show Dashboard (default on): the variance-decomposition panel.
- Gradient Fill (default on): style toggle for the zero-to-value fill.
Frequently Asked Questions

The Library is free. Quant makes it yours.
Pull any concept or indicator into Quant: rebuild it, retune it, or turn it into a backtested strategy of your own.