Concept
Jump Detection
Jump Detection, also known as bipower variation, is a Volatility concept. The Library holds 1 implementation, a working definition you can pull into Quant.
Top Jump Detection indicator
The top custom implementation, built on the original standard Jump Detection formula.
1 total
Want to trade Jump Detection? The implementation below is one prompt away from a backtested strategy in Quant.
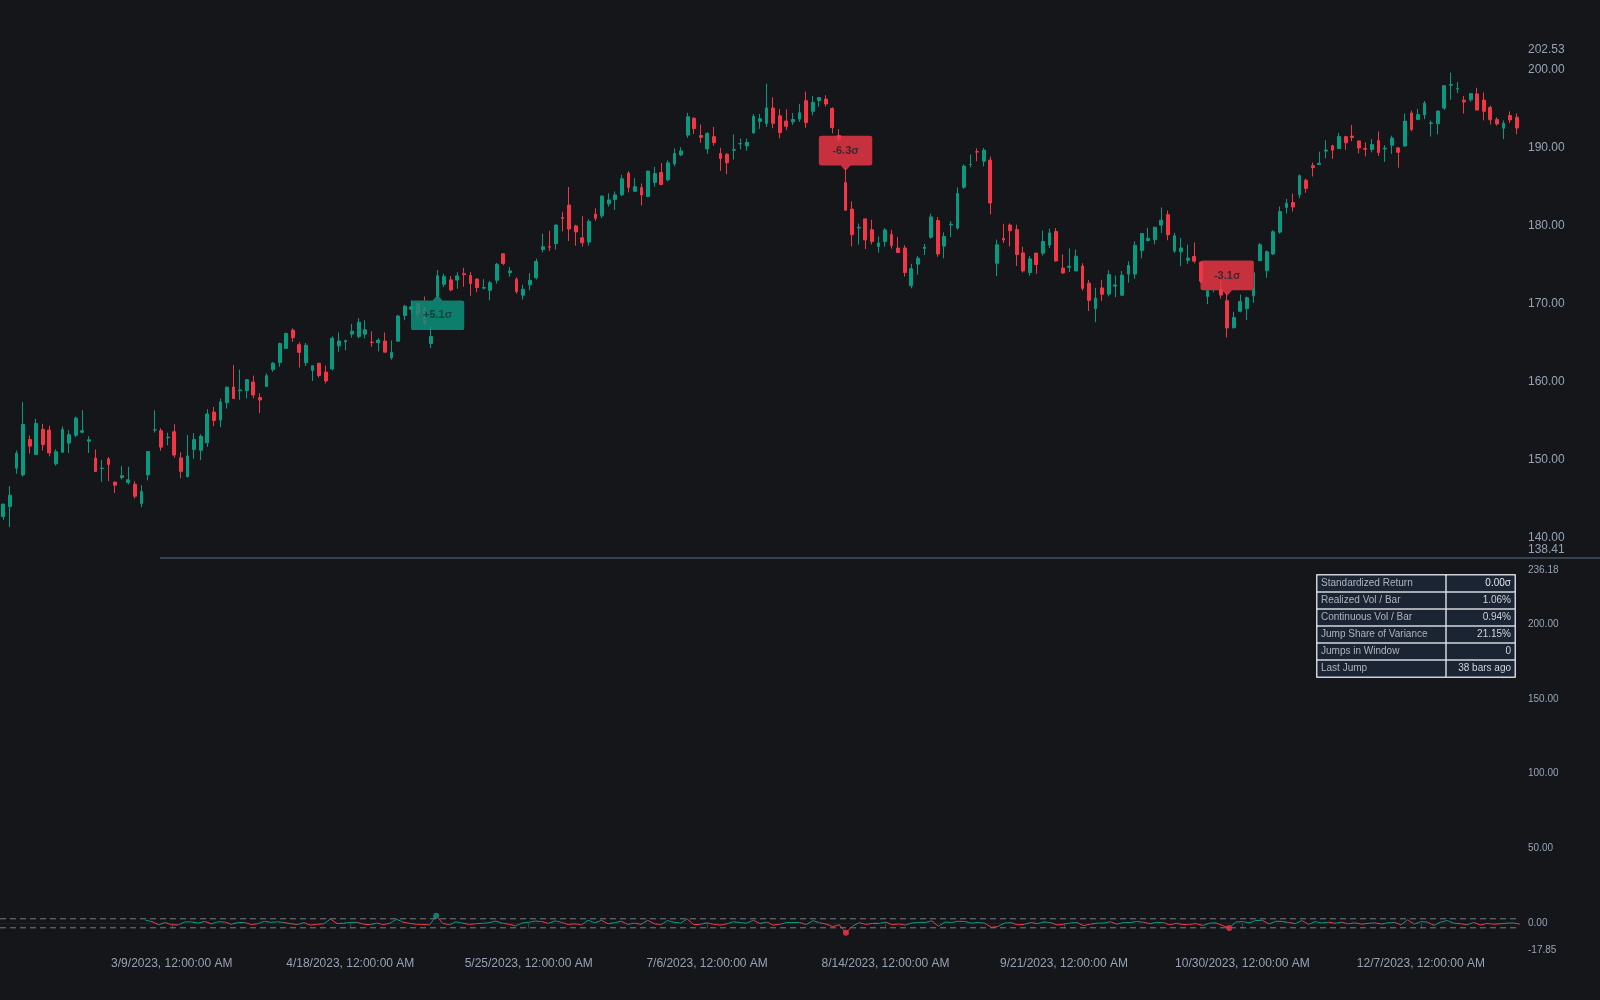
What is Jump Detection?
Jump detection separates the discontinuous part of price movement, sudden repricings and gaps typically tied to news, from the continuous diffusion-like part. The canonical high-frequency tool is bipower variation, due to Barndorff-Nielsen and Shephard: realized variance, the sum of squared intraday returns behind realized volatility, captures continuous variation plus jumps, while bipower variation, built from products of absolute adjacent returns, is robust to jumps and estimates the continuous part alone. A statistically large gap between the two flags a jump.
The idea has a long pedigree in quantitative finance. Merton added a jump component to the standard diffusion model of prices in 1976, formalizing the point that some moves are discontinuities rather than fast diffusion. The econometrics of telling the two apart matured with high-frequency data: Barndorff-Nielsen and Shephard developed bipower variation in the early 2000s, and Lee and Mykland later added a widely used test that flags individual intraday returns as jumps. The CUSUM technique seen in trading implementations is older still, dating to Page's 1954 work on detecting shifts in industrial processes.
Chart-level implementations are simpler: returns beyond a volatility-scaled threshold, CUSUM-style tests for abrupt level shifts, or plain gap detection. However it is measured, the point is the same: jumps are a different risk from ordinary volatility, because price can move through a stop without ever trading at the prices in between.
The distinction matters for anything calibrated to typical conditions. Volatility estimators, band widths, and position sizes all assume tomorrow resembles a weighted average of the recent past, and a jump violates that by injecting one enormous observation into the window. It also matters for interpretation: a market whose measured volatility comes from continuous churn behaves differently from one whose variance arrives in occasional lurches, even when both print the same headline number. Separating the components tells you which market you are in, information a single ATR reading blends away.
How to spot jumps on a chart
Formal tests need intraday data, but candidate jumps are visible on any chart:
- 1Flag bars whose move is a large multiple of recent typical movement, measured against average true range or a rolling standard deviation.
- 2Check for discontinuity: an open printing far from the prior close, or a move so fast that price skipped levels rather than trading through them. A jump is a repricing, not merely a busy bar.
- 3Distinguish it from range expansion: expansion is a stretch of larger bars that persists; a jump is one isolated dislocation against an ordinary backdrop.
- 4Look for the catalyst: genuine jumps usually align with earnings, macro releases, or surprise headlines; an apparent jump with no news deserves suspicion as a data artifact or thin print.
- 5With intraday data, run the formal comparison: realized variance minus bipower variation over the day estimates the jump contribution, and a statistically large gap is the flag.
How traders use it
- To clean volatility estimates: excluding or down-weighting identified jump days keeps one-off shocks from inflating trailing volatility and everything sized off it.
- As an event flag: detected jumps usually coincide with identifiable catalysts, so they can trigger a regime reassessment or pause systems tuned to normal conditions.
- For risk budgeting: markets that jump frequently warrant smaller size at a given measured volatility, since stops cannot be relied on to cap loss through a gap.
- As a caveat on band signals: envelope tools assume levels get reached tradeably, but a jump lands beyond a Bollinger Band or ATR band in one print, so tags produced across a jump bar are usually treated separately from ordinary touches.
- To keep history honest: when building a volatility percentile or regime rank, flagging jump days prevents a single event from defining the high end of the distribution for weeks of subsequent comparisons.
Jump detection vs standard volatility measures
Realized Volatility: Realized volatility totals all variation, continuous and discontinuous alike. Jump detection is the decomposition of that total; together the two say not just how much a market moves but how it moves.
ATR: ATR averages bar ranges, so one jump inflates it for the entire lookback and then drops out abruptly. Jump detection isolates exactly the observations that cause that distortion.
Range Expansion/contraction: Expansion and contraction describe volatility regimes that persist for stretches; a jump is an instantaneous event. A market can jump out of a quiet regime without the regime itself changing.
Concept family
Volatility
57 concepts mapped · 57 in the Library
Jump Detection FAQ
Turn Jump Detection into a trading strategy.
Take the implementation from this page into Quant, then build on it, backtest it on real data, and keep refining it in conversation.