Kalman Filter
 By LuxAlgoApr 24, 2026
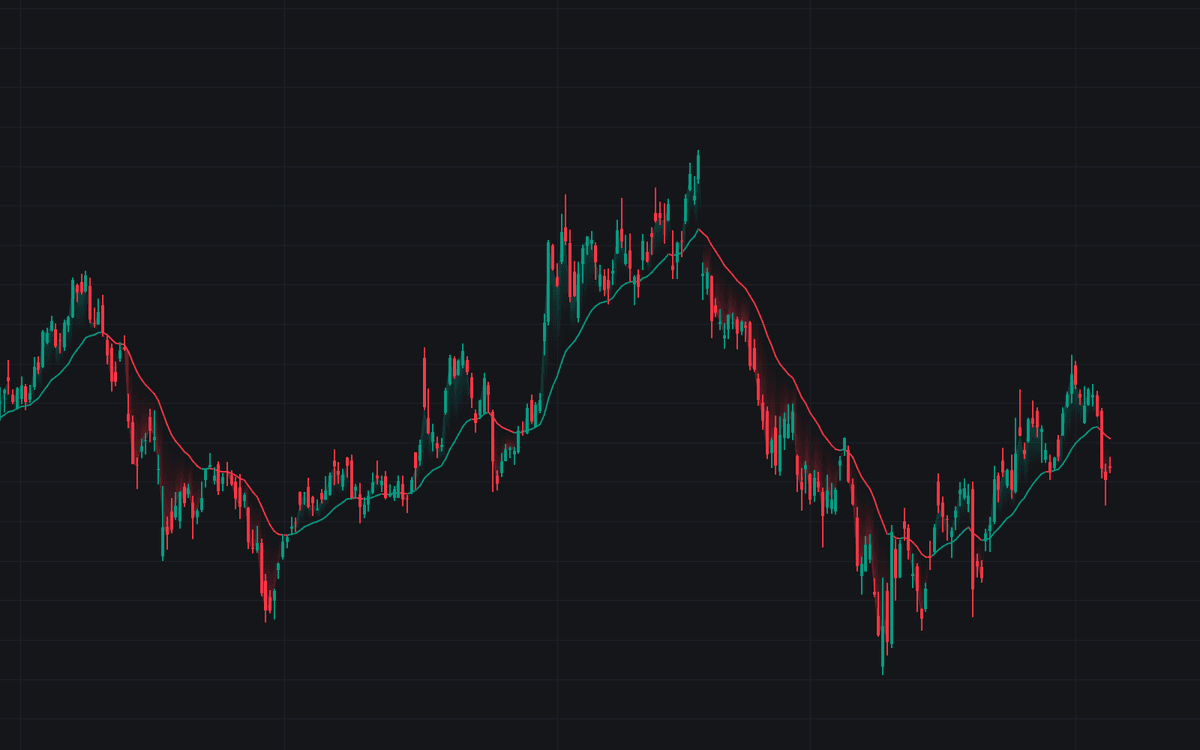

Kalman Filter brings the Kalman filter to the chart as a clean single-line adaptive smoother: every bar the estimate is carried forward, its uncertainty widened by the process noise, and the prediction pulled toward the new price by the Kalman gain. The line colors by its slope, a gradient fill spans price and filter, and the live gain is readable in the data window. The recursion is causal on purpose - each bar's estimate is formed without peeking forward, so printed values never repaint.
How to Trade the Kalman Filter?
- Price crossing the filter: read exactly like moving-average crossovers, with responsiveness set by the noise model instead of a bar count; optional markers, alerts either way.
- Slope color flip: bullish while the filtered level rises, bearish while it falls, with dedicated slope-turn alerts.
- Gradient fill: price holding above the estimate frames it as a trailing reference that pullbacks keep testing.
Watching the Kalman Gain readout while adjusting settings is the fastest way to learn the tool - it is the live smoothness-versus-lag consequence of your Q/R choice.
Kalman Filter Settings
- Source (default close): the measurement fed to the filter; feeding a noisy indicator series instead covers the pre-processing use.
- Process Noise (Q) (default 0.01): how strongly the level itself is assumed to wander per bar. Raising it lifts the gain so the line hugs price; lowering it smooths at the cost of lag.
- Measurement Noise (R) (default 1): how noisy each print is assumed to be. Raising it flattens the line so it rides out chop.
- Slope Trend Coloring (default on): direction-colored line; disable for the neutral color.
- Price / Filter Gradient Fill (default on) and Price Crossing Markers (default off): display toggles - crossing alerts work regardless.
Frequently Asked Questions

The Library is free. Quant makes it yours.
Pull any concept or indicator into Quant: rebuild it, retune it, or turn it into a backtested strategy of your own.