Kase Studies
 By LuxAlgoMay 24, 2026
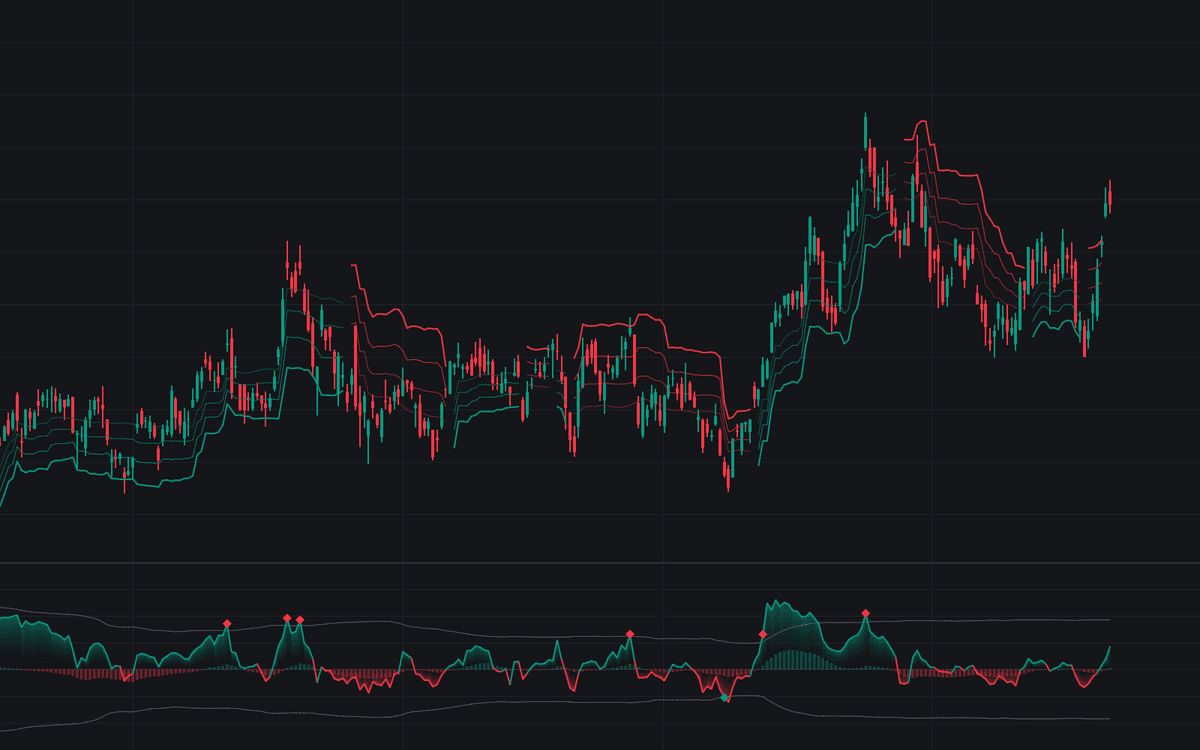

Kase Studies is the definitive clean implementation of the Kase studies suite. The Peak Oscillator sizes every move in volatility units over a scanned range of lookbacks from 8 to 65 bars, plotting the strongest up statistic minus the strongest down statistic; KaseCD, its MACD-style derivative, sits behind it as a histogram for divergence work; and the DevStop exit ladder is drawn directly on the price chart.
How to Trade the Kase Studies?
- Peak-out diamond: the oscillator stretched beyond a threshold built from 2 deviations of its own history - an exhaustion candidate, grounds to take profits or tighten stops, never an automatic reversal.
- KaseCD divergence: price presses a new extreme but the histogram tops out lower - momentum internals thinning.
- Zero-line cross: volatility-normalized up-moves or down-moves now dominate; alerts fire both ways.
- DevStop ladder: a close under the warning line is the first rung giving way; a close through DevStop 3 flips the ladder to the other side.
Thresholds derive from the instrument's own behavior, so one setting serves very different markets - the suite's design premise.
Kase Studies Settings
- Scan Lengths (default 8 to 65): shortest and longest trend lengths scanned.
- Peak-Out Threshold (Deviations) (default 2) and Threshold History (default 100): multiple and window behind the peak-out lines.
- Show KaseCD Histogram (default on), with Fast Length (default 12) and Slow Length (default 26).
- Show DevStops on Price (default on): the exit ladder.
- Deviation Window (default 20): bars behind the mean and deviation of the two-bar true range.
- Stop 1 / Stop 2 / Stop 3 (defaults 1, 2.2, 3.6): deviation steps beyond the warning line.
- Oscillator Gradient and Peak-Out Markers (both default on): style toggles.
Frequently Asked Questions

Original indicatorBuilt in-house by LuxAlgo
The Library is free. Quant makes it yours.
Pull any concept or indicator into Quant: rebuild it, retune it, or turn it into a backtested strategy of your own.