Concept
Kase Studies
Kase Studies, also known as Peak Oscillator, KaseCD, DevStops, are Volatility concepts. The Library holds 1 implementation, a working definition you can pull into Quant.
Top Kase Studies indicator
The top custom implementation, built on the original standard Kase Studies formula.
1 total
Want to trade Kase Studies? The implementation below is one prompt away from a backtested strategy in Quant.
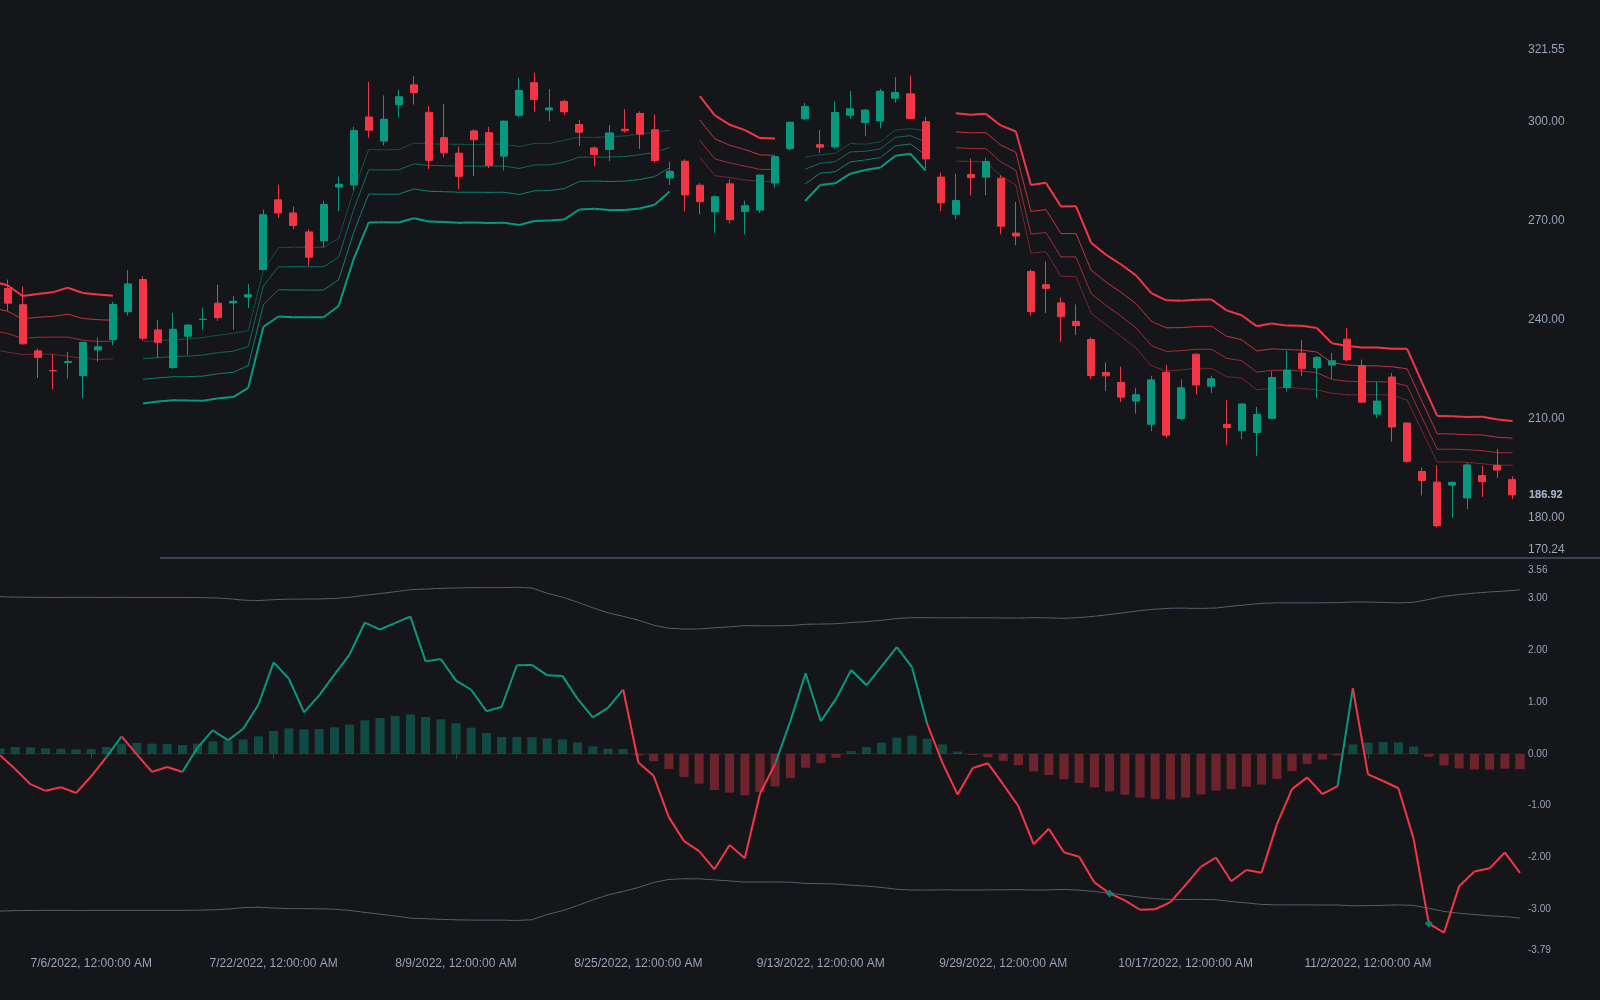
What are the Kase Studies?
The Kase studies are a suite of volatility-normalized tools developed in the early 1990s by Cynthia Kase, a chemical engineer turned energy trader. The unifying idea is to measure price movement in volatility units across a scan of lookback lengths, so signals adapt to conditions rather than being retuned per market. The best-known members: the Kase Peak Oscillator, momentum built from statistics that compare volatility-normalized up-moves and down-moves; KaseCD, a MACD-style histogram of the peak oscillator used for divergence work; and Kase DevStops, trailing stops placed at standard-deviation multiples of a two-bar true range, adjusted for the skew of range distributions.
Kase laid the suite out for a general audience in her 1996 book Trading with the Odds, and the statistical framing is the whole personality: instead of asking where price is relative to a line, every tool asks how large the current move is relative to what the instrument's own recent volatility calls ordinary. That is what lets one threshold serve a gas future and an equity index alike, and it is why the tools scan multiple bar lengths rather than trusting a single fixed lookback.
The signature signal is the 'peak out': a peak oscillator reading beyond a threshold derived from its own history (commonly around two standard deviations), flagging a statistically stretched move as an exhaustion candidate. The studies grade the quality of a move, how far price traveled relative to what its volatility calls normal, rather than forecasting direction.
The pieces are designed as one workflow. The Peak Oscillator raises the exhaustion flag, KaseCD refines it by showing whether momentum's internals diverge from price, and DevStops answer the practical question the first two raise, where the exit belongs, with stops budgeted for the skewed, fat-tailed way ranges actually behave. None of it forecasts; a peaked market can keep running, which is why the suite reads as a risk-management instrument first.
How to read the Kase studies on a chart
The suite plots as an oscillator pane (Peak Oscillator / KaseCD) plus stop lines on price; the reading runs from flag to divergence to exit.
- 1Add the Peak Oscillator and note its threshold lines, derived from the oscillator's own historical extremes rather than fixed constants.
- 2Watch for peak-out marks: readings stretching beyond the threshold flag a move that is statistically extended for this instrument and timeframe.
- 3Check KaseCD at the same swings: price pressing a new extreme while the histogram prints a weaker peak is the divergence that upgrades the warning.
- 4Overlay DevStops for the exit ladder: several lines at increasing deviation steps, the outer ones ceding more room and surviving more noise.
- 5Act through structure, not the oscillator alone: the flags justify tightening risk or seeking reversal setups, while entries still come from price behavior.
How it's calculated
The Peak Oscillator and KaseCD read volatility-normalized momentum, while DevStops place volatility-scaled trailing stops.
Cynthia Kase's original StatWare code is proprietary; these are the standard public reconstructions, and platform implementations differ in detail.
The 2.2 and 3.6 stop multiples adjust the 2 and 3 sigma levels for the right skew of the true range distribution; the mean alone (k = 0) is plotted as a warning line.
PeakOut markers typically flag KPO readings beyond about 2 standard deviations, or the 90th percentile, of its recent values.
How traders use it
- For exhaustion candidates: peak-out flags and divergences between price and KaseCD mark statistically overextended momentum, read as a cue to tighten risk rather than an automatic reversal.
- For exits: DevStops trail at volatility-scaled distances in the same family as other volatility stops, with the outer lines granting a trend more room at the cost of giving back more on the turn.
- As a cross-market read: volatility normalization means the same thresholds are intended to transfer across instruments and timeframes without re-tuning, one of Kase's stated design goals.
- As regime context: the deviation framing pairs naturally with a volatility percentile view, so a peak-out during an already-extreme volatility regime is graded differently from one in a quiet tape.
- As a complement to channel tools: traders who ride trends inside Keltner-style channels use Kase flags as the statistical second opinion on when a band walk has become an outlier move.
Kase studies vs related volatility tools
ATR: ATR is the raw volatility yardstick: one smoothed number per bar. The Kase studies are consumers of that kind of measurement, converting moves into deviation units and attaching thresholds, divergence logic, and stop ladders on top.
Keltner Channels: Keltner Channels wrap an average with an ATR offset and read price against the envelope continuously. DevStops instead ladder standard-deviation steps of a two-bar true range behind the trend, skew-adjusted, purpose-built as exits rather than as a general channel.
Realized Volatility: Realized volatility summarizes returns over a window in annualized terms, a statistician's measure with no chart levels attached. The Kase tools stay in bar-range units and immediately spend the measurement on flags and stops a trader can act on.
Concept family
Volatility
57 concepts mapped · 57 in the Library
Kase Studies FAQ
Turn Kase Studies into a trading strategy.
Take the implementation from this page into Quant, then build on it, backtest it on real data, and keep refining it in conversation.