Lead-lag Detection
 By LuxAlgoJun 6, 2026
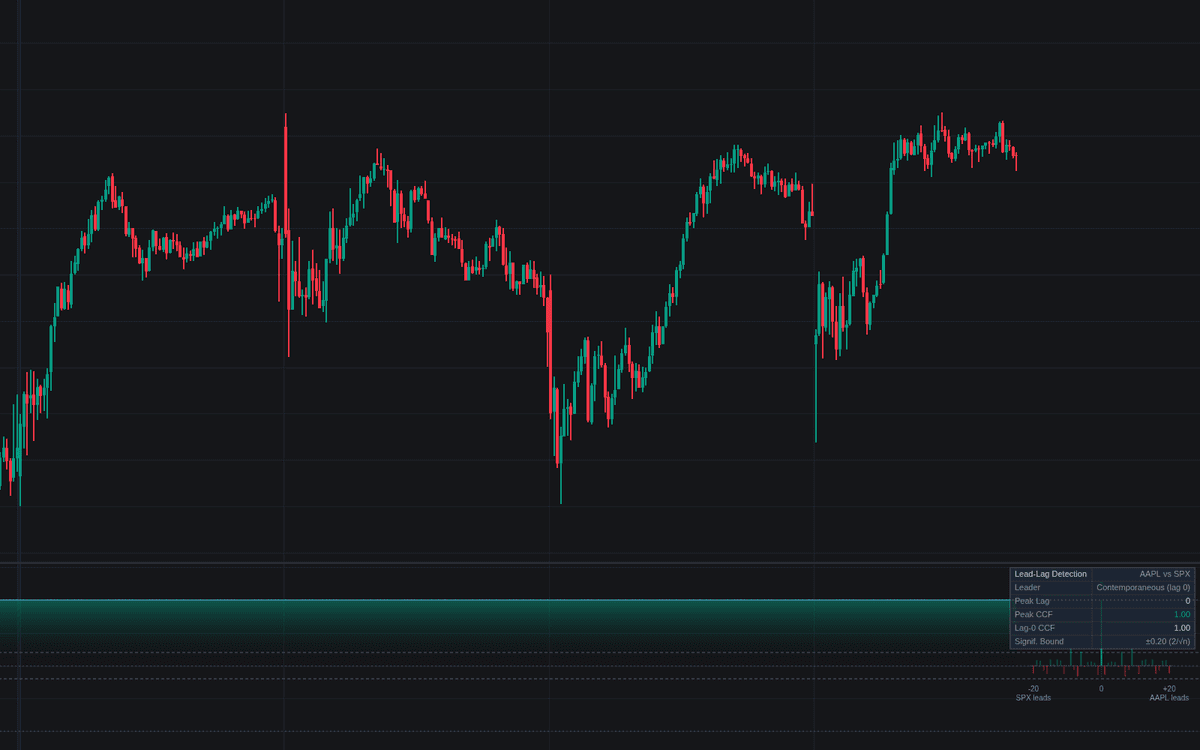

Lead-lag Detection measures whether the chart symbol systematically moves before or after a related instrument, and by how many bars. The cross-correlation sweep behind lead-lag detection reruns on both series' returns every bar, from -20 to +20 lags, and the peak value plots with approximate significance bounds at 2/sqrt(n). A relationship is only called while the peak sits at a nonzero lag beyond the bounds; the dashboard names the leader and its lag in plain language.
How to Trade the Lead-lag Detection?
- Peak at a positive lag: the chart symbol leads the comparison by that many bars; at a negative lag, the comparison leads the chart.
- Significance first: inside the bounds the honest read is no significant lead - alerts mark the transitions in and out.
- Compare against lag 0: the Lag-0 Correlation plot shows the plain contemporaneous correlation - the value added by shifting one series in time, at a glance.
Peak Lag Shift and Leader Flip alerts round out the set - a relationship is only worth trusting while its lag and sign persist.
Lead-lag Detection Settings
- Comparison Symbol (default SP:SPX): the second instrument of the pair.
- Source (default close) and Returns (default Log): the correlated series, sampled only on fresh comparison bars so session mismatches cannot fabricate lags.
- Correlation Window (default 100): overlapping observations n at every lag, and the bounds.
- Max Lag (default 20): the sweep spans -K to +K bars; wider sweeps multiply the odds of spurious peaks.
- Show Profile (on) with Profile Offset (default 5): the per-lag correlogram beside the last bar.
- Show Dashboard (on, Top Right, Small); style: Lag-0 Correlation (on), Normalized Peak Lag (off), Significance Bounds (on).
Frequently Asked Questions

Original indicatorBuilt in-house by LuxAlgo
The Library is free. Quant makes it yours.
Pull any concept or indicator into Quant: rebuild it, retune it, or turn it into a backtested strategy of your own.