Concept
Lead-lag Detection
Lead-lag Detection, also known as cross-correlation with lag, is a Statistics concept. The Library holds 1 implementation, a working definition you can pull into Quant.
Top Lead-lag Detection indicator
The top custom implementation, built on the original standard Lead-lag Detection formula.
1 total
This Lead-lag Detection implementation is strategy-ready: open it in Quant, set your rules, and it backtests automatically.
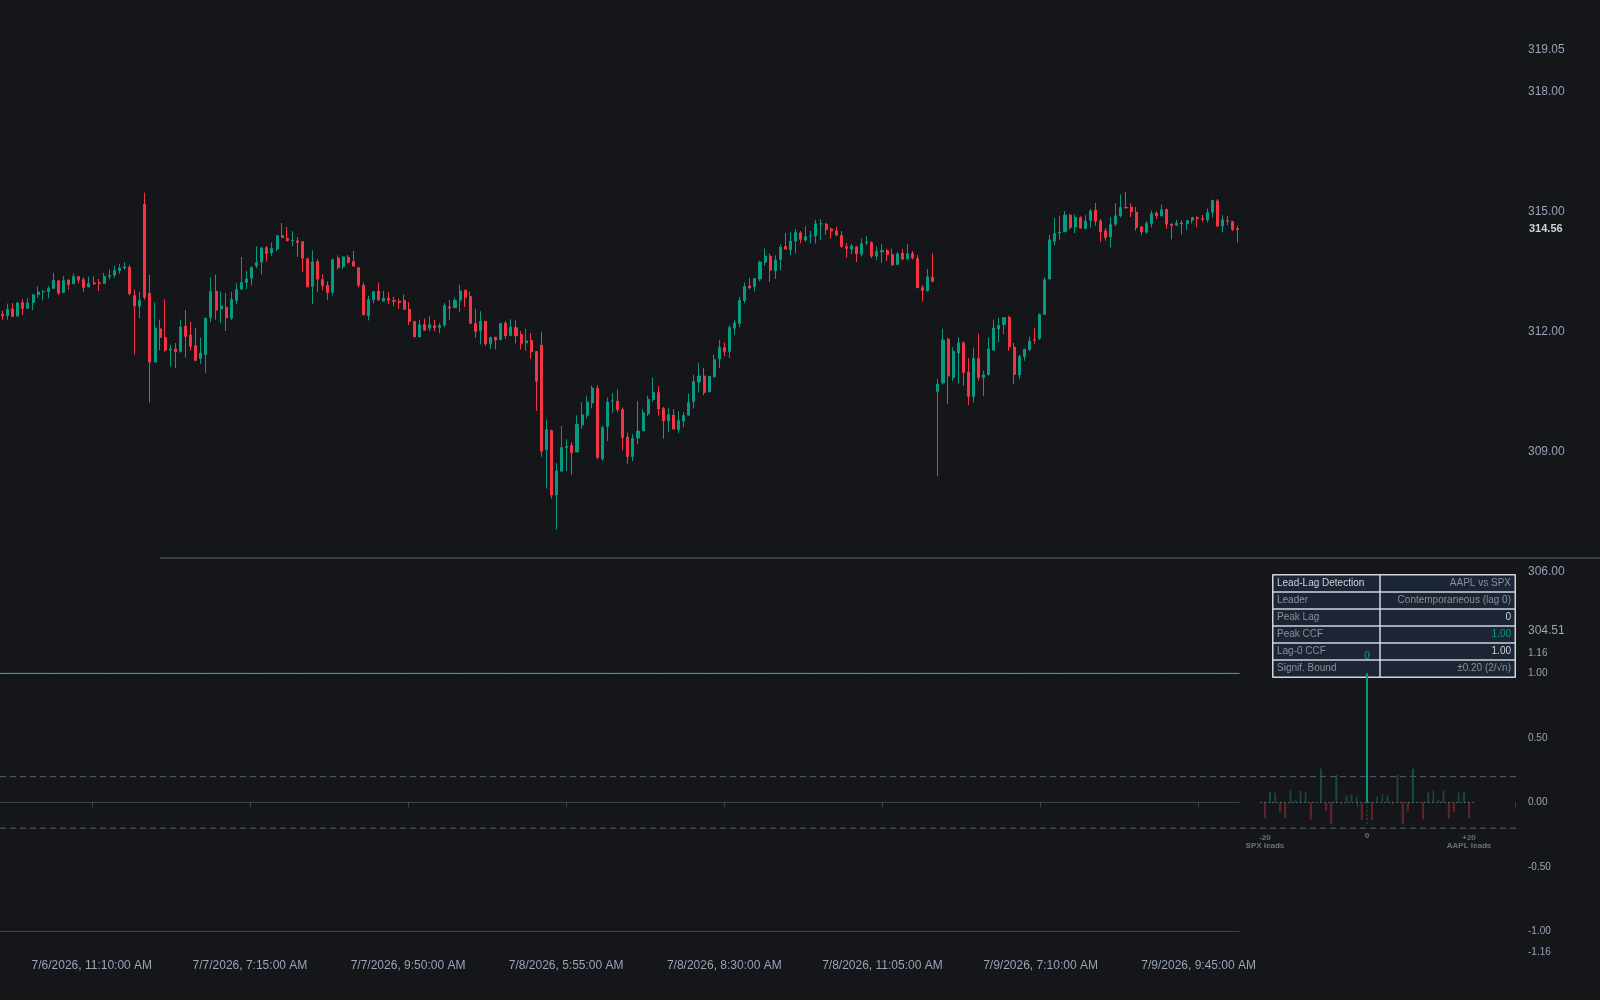
What is lead-lag detection?
Lead-lag detection asks whether one instrument's moves systematically precede another's. The workhorse tool is cross-correlation with lag: compute the correlation between series A's returns and series B's returns shifted by k bars, sweep k across a range of positive and negative values, and look at where the correlation peaks. A clear peak at a nonzero lag suggests one series carries information about the other's near future; traders call the front-runner the leader and the trailer the lagger.
The economic motivation is that information does not hit all markets simultaneously. Index futures tend to move before the constituent basket, large liquid names before small illiquid ones, and macro-sensitive instruments before the assets they discount. This is the quantitative backbone of intermarket analysis: rather than asserting that bonds lead equities, the cross-correlation function measures whether, by how many bars, and how strongly in the sample at hand.
The honest caveats are substantial. In liquid modern markets, exploitable lead-lag at daily resolution is largely arbitraged away; what survives tends to live at intraday horizons and decays quickly once discovered. Apparent lags can also be artifacts: nonsynchronous closing times across exchanges, stale prices in illiquid instruments, or a shared response to a third factor. And a peak correlation at lag k is a statement about averages, not a mechanism, which is why practitioners often supplement cross-correlation with Granger-causality style tests before trusting a relationship.
How it's calculated
The sample cross-correlation function between return series x and y at lag k:
A peak at positive k under this convention means x leads y by k bars; check your library's sign convention, as they differ.
Approximate significance bounds of +/- 2 / sqrt(n) are common, but serial dependence in returns makes these bounds optimistic.
How traders use it
- Signal construction: a detected leader becomes a conditioning input for trading the lagger, the systematic version of the discretionary practice covered under lead-lag instrument triggers.
- Pairs and spread work: before building a spread, checking the cross-correlation function alongside cointegration tests clarifies whether the pair moves together contemporaneously or with a usable delay.
- Rolling monitoring: lead-lag structure is unstable, so practitioners recompute it on rolling windows and treat a relationship as live only while the peak lag and sign persist; a leader in one regime is often a laggard or noise in the next.
- Data hygiene first: aligning timestamps, using returns rather than prices, and accounting for market-hours mismatches removes the most common spurious lags, which otherwise dominate cross-market studies.
- For relationships that stretch and compress in time rather than holding a fixed delay, dynamic time warping similarity offers a complementary, more flexible alignment.
Lead-lag detection vs related concepts
Correlation: Plain correlation measures the contemporaneous relationship at lag zero; lead-lag detection sweeps the lag axis to find whether the relationship is stronger with one series shifted in time.
Cointegration: Cointegration is about a long-run equilibrium between price levels that deviations revert to; lead-lag is about short-run timing of moves. A pair can exhibit either, both, or neither.
Autocorrelation: Autocorrelation is the same lag-sweep idea applied to a single series against itself, measuring memory within one instrument rather than timing between two.
Concept family
Statistics
46 concepts mapped · 46 in the Library
Lead-lag Detection FAQ
Turn Lead-lag Detection into a trading strategy.
Take the implementation from this page into Quant, then build on it, backtest it on real data, and keep refining it in conversation.