Livermore Pivotal Point
 By LuxAlgoJun 21, 2026
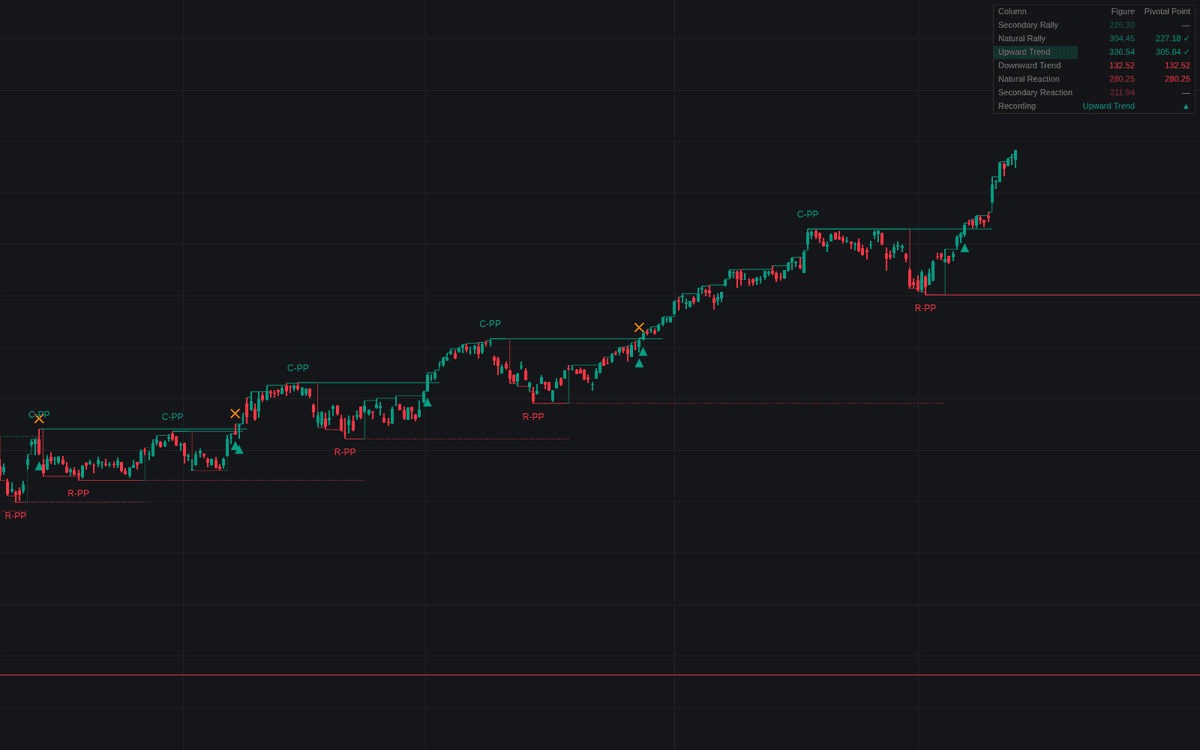

Livermore Pivotal Point is the definitive clean automation of the Livermore pivotal point method: the six-column price record is kept bar by bar with percent-scaled thresholds, rally and reaction extremes are underlined as pivotal points the moment the record moves on, and every level is tracked through its lifecycle - penetration, prompt follow-through, or the stalled break read as a danger signal.
How to Trade the Livermore Pivotal Point?
- Break marker (triangle): price penetrates an active pivotal point - the entry cue in a method that acts only on penetration, never inside the base.
- Follow-through confirmed: the break extends beyond the confirmation threshold and the record transfers to a trend column.
- Danger signal (cross): price crossed a pivotal point but closed back through it before reaching confirmation - treated as an exit cue, always evaluated on the close.
- C-PP versus R-PP labels: continuation points confirm the prevailing trend resuming; reversal points start a new trend after a base or climax.
The record table shows all six columns, active pivotal points with break status, and the column being recorded.
Livermore Pivotal Point Settings
- Threshold Units (default Percent): scales the point rules to any price level; Points uses raw units, as in the 1940 Market Key tables.
- Natural Rally/Reaction Threshold (default 6): counter-move that opens a Natural Rally or Reaction record.
- Confirmation Threshold (default 3): extension beyond a pivotal point that confirms follow-through.
- Record Source (default High/Low): bar extremes, or closes only.
- Pivotal Point Levels / Labels, Break Markers, Danger Signal Markers, Price Record Trail (all default on): display layers.
- Record Table (default on) with position and size; Level Width (default 1).
Frequently Asked Questions

Original indicatorBuilt in-house by LuxAlgo
The Library is free. Quant makes it yours.
Pull any concept or indicator into Quant: rebuild it, retune it, or turn it into a backtested strategy of your own.