Dow Theory
 By LuxAlgoJun 21, 2026
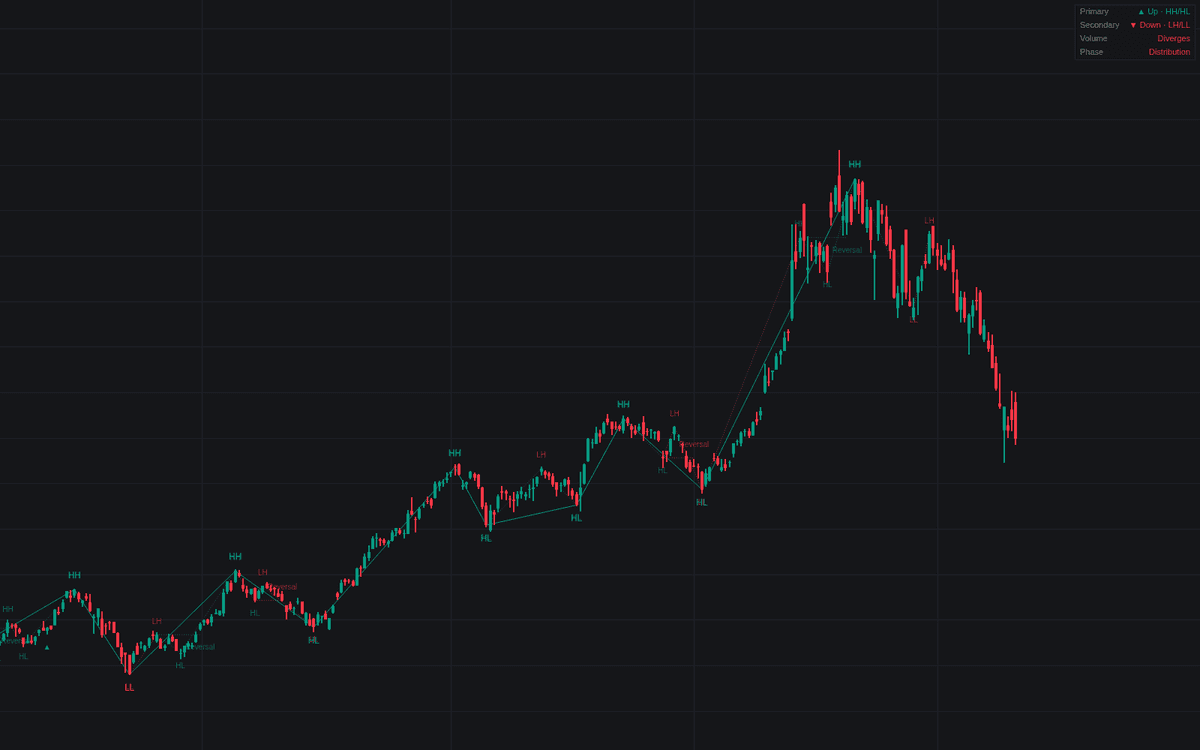

Dow Theory turns the oldest codified trend framework into a mechanical chart read: it confirms swings at two degrees of structure, labels each HH, HL, LH or LL, and classifies the primary and secondary trends from the sequence, presuming each in force until a failure swing delivers a definite reversal. Beyond the swing labels, this build charts the remaining tenets of Dow Theory too: volume confirmation, index confirmation against a second symbol, and a phase read combining both degrees.
How to Trade the Dow Theory?
- ▲ / ▼ markers: the primary trend classified from the swing sequence alone: paired rising (or falling) swing highs and lows.
- Reversal tags: a failed swing, then a decisive close through the prior swing point, the framework's definitive trend-change signal.
- Volume row: Confirms when average volume on bars moving with the primary trend outweighs volume against it; Diverges is an early caution.
- Phase row: the two trend states combine into Accumulation, Markup, Distribution or Markdown.
Alerts cover trend flips and reversals at both degrees plus index non-confirmation.
Dow Theory Settings
- Primary Swing Length (default 20): confirmation width of the swings defining the primary trend.
- Secondary Swing Length (default 5): swing width for the secondary reactions inside the primary move.
- Price Basis (default Close): detect swings on closes or on High/Low wick extremes.
- Confirmation Index (default empty): optional related index compared with the chart's primary trend.
- Volume Window (default 50): window for averaging advancing-bar versus declining-bar volume.
- Show Dashboard (default enabled); Swing Lines, Primary Swing Labels, Secondary Structure, Trend Change Markers and Trend Background style toggles all default on.
Frequently Asked Questions

Original indicatorBuilt in-house by LuxAlgo
The Library is free. Quant makes it yours.
Pull any concept or indicator into Quant: rebuild it, retune it, or turn it into a backtested strategy of your own.