Concept
Livermore Pivotal Point
Livermore Pivotal Point is a Market Structure concept. The Library holds 1 implementation, a working definition you can pull into Quant.
Top Livermore Pivotal Point indicator
The top custom implementation, built on the original standard Livermore Pivotal Point formula.
1 total
Want to trade Livermore Pivotal Point? The implementation below is one prompt away from a backtested strategy in Quant.
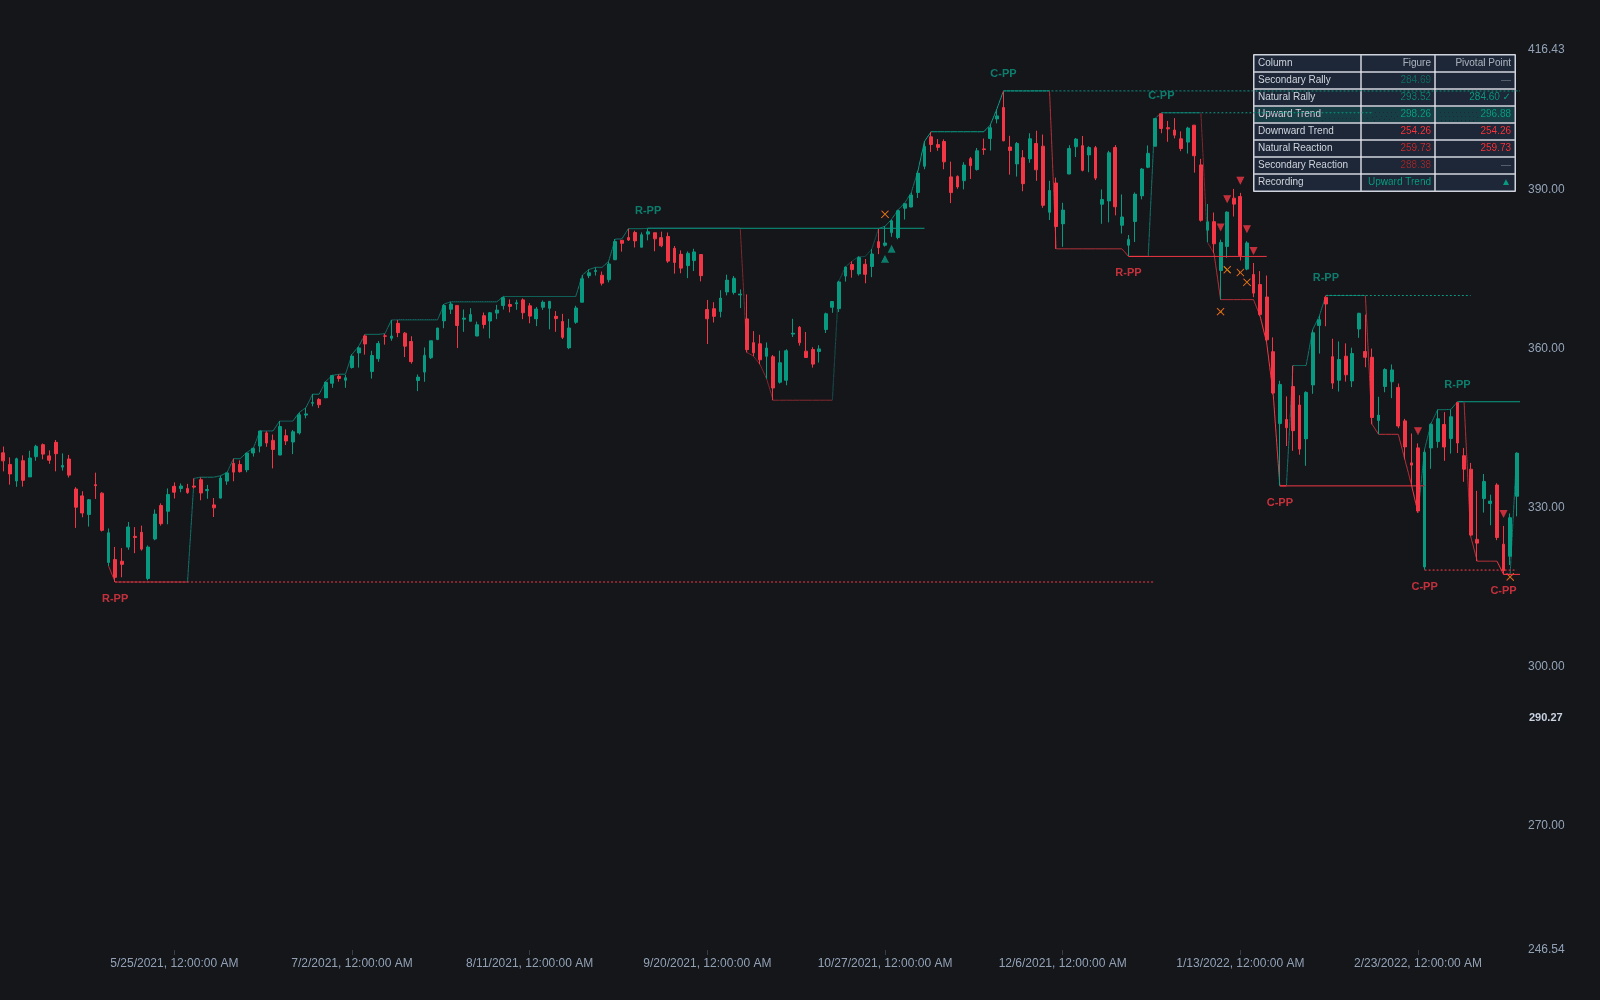
What is a Livermore Pivotal Point?
A Livermore pivotal point is the price at which, in Jesse Livermore's method, the real trend of a stock is decided. In How to Trade in Stocks (1940) he described two kinds: reversal pivotal points, where a new trend begins after a base or a climax, and continuation pivotal points, the consolidation levels within an existing trend whose penetration confirms the move is resuming. He also treated psychologically loaded prices, such as round numbers and new highs, as natural pivotal points.
The method around the level is the real content. Livermore waited for price to penetrate the pivotal point rather than anticipating it, wanted expanding activity on the move (an ancestor of watching volume at breakout), and demanded prompt follow-through: a stock that crossed its pivotal point and then stalled was showing a danger signal, and he treated that failure as the cue to get out. Modern breakout and buy-point trading inherits this logic almost unchanged.
The pivotal point sat inside a larger apparatus: the Livermore Market Key, his hand-kept ledger of prices in ruled columns, natural rally, natural reaction, upward trend, downward trend, with fixed point thresholds deciding when an entry moved between columns. Pivotal points emerged from the records, underlined when the ledger showed a price the trend kept answering to, which is why his book insists the method is the records, not intuition. The famous anecdotes dramatize the psychology half: his Anaconda trade keyed off the crossing of a big round figure, on the argument that a stock pushing through such a price against everyone watching it has proven something.
The lineage runs straight into the present. William O'Neil's buy points, bases and follow-through rules are the pivotal-point method with modern charting, a debt O'Neil acknowledged; structure vocabulary like break of structure restates the continuation pivot's logic; and his danger signal is today's false breakout, read as an exit rather than merely a disappointment. The honest coda belongs in any account: Livermore's method did not save Livermore, whose fortunes rose and collapsed repeatedly, which argues the rules' value lies in what they systematize, not in the biography attached to them.
How to identify a Livermore pivotal point
Map candidates in advance, then let penetration and follow-through do the deciding.
- 1Mark the candidates before the market opens the question: base boundaries, consolidation edges, prior significant highs and lows, and psychologically loaded round figures.
- 2Refuse anticipation: the method's first rule is that no position exists until price actually penetrates the pivotal point.
- 3Demand expanding activity on the penetration: volume growing with the move was Livermore's confirmation that real interest, not drift, crossed the level.
- 4Demand prompt follow-through: the move should continue decisively within a short time of the cross; hesitation is information.
- 5Treat the stall as the danger signal: a cross that fails to follow through is exited immediately, keeping the failed break a small cost instead of a thesis debate.
How traders use it
- As an entry discipline: buy or sell only on penetration of the pivotal point, not inside the base, so the market has to prove the move before capital is committed.
- As built-in invalidation: the absence of immediate follow-through after the cross is itself the exit signal, which keeps failed breaks small instead of letting them become full reversals.
- As a mapping exercise: prior bases, consolidation edges, old highs, and round figures are marked in advance as candidate pivotal points so the reaction there is observed rather than improvised.
- As a pyramiding schedule: Livermore added to winners at successive continuation pivots, each penetration re-proving the trend before more capital followed, never averaging into weakness.
- In modern structure terms: continuation pivots map onto swing-structure breaks, so contemporary structure tools effectively automate the ledger work his Market Key did by hand.
Pivotal points vs modern structure concepts
Break of Structure: The modern term for the continuation pivot's event: a swing boundary giving way in the trend's direction. Livermore's version adds the handling rules, no anticipation, expanding activity, prompt follow-through, that the bare structural label leaves to the trader.
False Breakout: Livermore's danger signal formalized: a cross of the decisive level that fails to follow through. Where modern usage often treats the false break as a fade setup, Livermore's primary reading was defensive, the failure meant his position was wrong now, whatever the level might do later.
Swing Failure Pattern: The SFP is the trap the pivotal-point rules exist to survive: a probe through the level that reverses. Livermore's insistence on activity and follow-through is an early filter against exactly this event, converting it from account damage into a quick, planned exit.
Concept family
Market Structure
31 concepts mapped · 31 in the Library
Livermore Pivotal Point FAQ
Turn Livermore Pivotal Point into a trading strategy.
Take the implementation from this page into Quant, then build on it, backtest it on real data, and keep refining it in conversation.