Logistic Signal Calibration
 By LuxAlgoMar 8, 2026
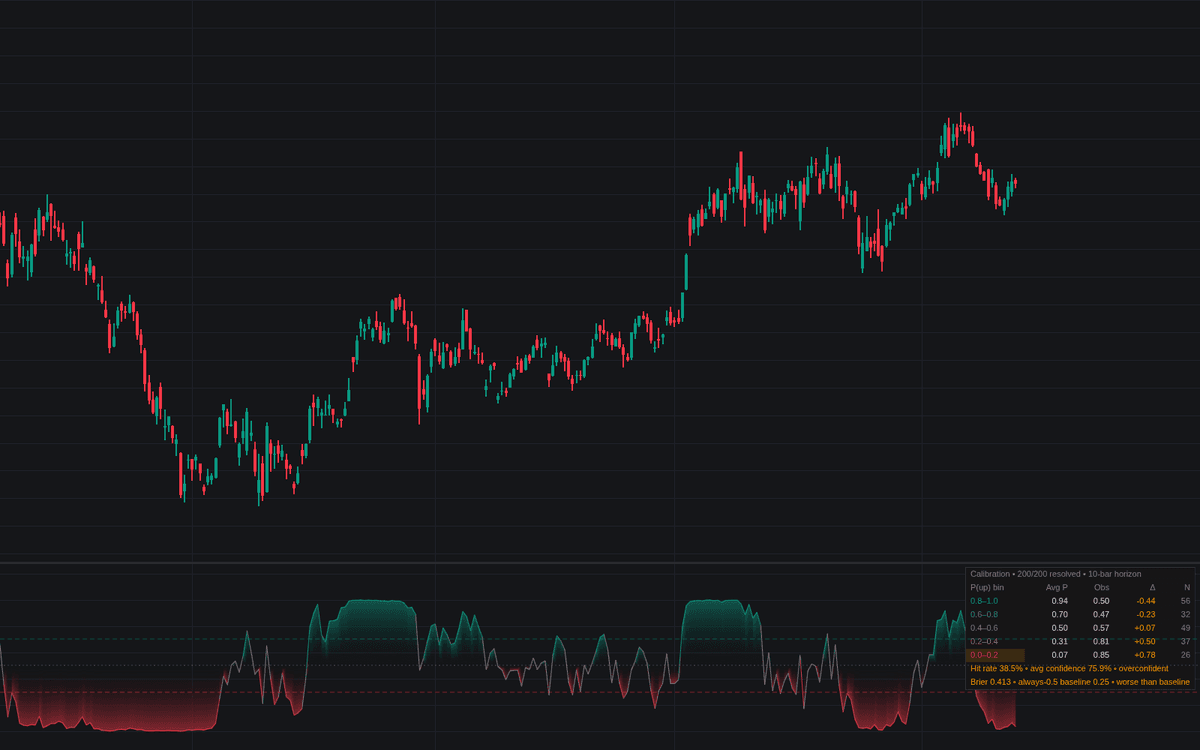

Logistic Signal Calibration implements logistic signal calibration as a transparent on-chart model: momentum, trend and volume-flow features are standardized to z-scores, weighted by coefficients set directly in the inputs, summed with an intercept into log-odds, and mapped through the sigmoid into a 0-to-1 score. The pane plots the calibrated probability against decision thresholds, and a reliability dashboard grades every score once its horizon resolves.
How to Trade the Logistic Signal Calibration?
- Score above the Bullish threshold: the long filter passes - marginal readings near 0.5 are skipped by construction.
- Score below the Bearish threshold: the short mirror; between the two is the no-edge, stand-aside band.
- Overconfidence highlights: bins where claimed probability exceeds observed frequency beyond one standard error turn orange.
- Brier score above 0.25: worse than a constant always-0.5 forecast; a calibration-decay alert fires on the cross.
Per-feature contributions stream to the data window, keeping every reading decomposable.
Logistic Signal Calibration Settings
- Source (default close).
- Momentum (default 14), Trend (default 50), Volume (default 20): the feature lookbacks, each paired with its logistic coefficient (default 1; 0 removes a feature, negative flips it).
- Intercept (Bias) (default 0): baseline log-odds - 0 rests the score at 0.5.
- Normalization Window (default 100): trailing z-score window for the features.
- Bullish (default 0.7) / Bearish (default 0.3): decision thresholds.
- Prediction Horizon (default 10): bars until each score resolves.
- Evaluation Window (default 200): resolved scores in the rolling calibration sample.
- Show Calibration Dashboard (default on); style toggles cover gradient fill, cross markers and line width.
Frequently Asked Questions

Original indicatorBuilt in-house by LuxAlgo
The Library is free. Quant makes it yours.
Pull any concept or indicator into Quant: rebuild it, retune it, or turn it into a backtested strategy of your own.