Concept
Logistic Signal Calibration
Logistic Signal Calibration is a Machine Learning concept. The Library holds 1 implementation, a working definition you can pull into Quant.
Top Logistic Signal Calibration indicator
The top custom implementation, built on the original standard Logistic Signal Calibration formula.
1 total
Want to trade Logistic Signal Calibration? The implementation below is one prompt away from a backtested strategy in Quant.
What is Logistic Signal Calibration?
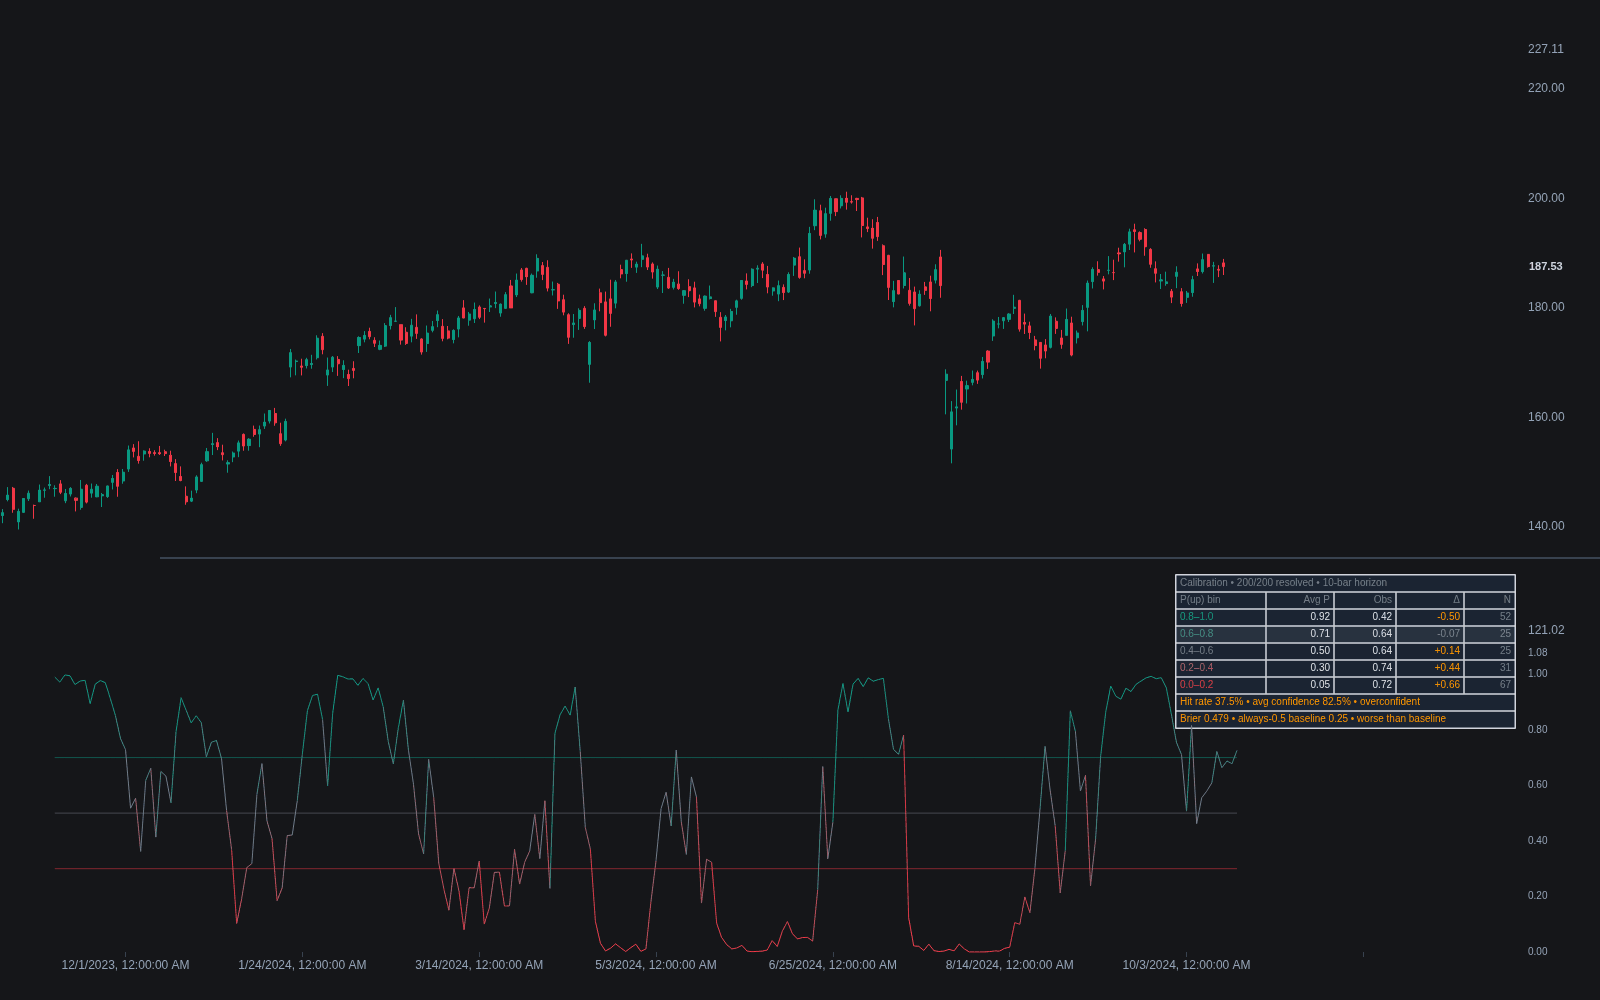
Logistic signal calibration is the use of logistic regression, or the logistic (sigmoid) function more generally, to turn indicator readings into a probability-style score between 0 and 1. Logistic regression models the log-odds of a binary outcome, such as price being higher after some number of bars, as a weighted sum of input features; the sigmoid maps that sum into the 0-to-1 range. Instead of a hard buy or sell flag, the output is graded: values near 1 read as confident bullish, near 0 as confident bearish, and near 0.5 as no edge.
Calibration is the stricter claim behind the score. A model is calibrated when its probabilities match observed frequencies: of all bars scored around 0.7, roughly 70 percent should resolve in the predicted direction. That property is fitted on historical data and decays as conditions drift, so the honest reading of a logistic score is ranked confidence, not a literal win probability. The weights themselves depend on feature engineering choices and on which label definition the model was trained against.
The model's virtues are fit for trading's constraints. Fitting is maximum likelihood, cheap enough for modest data and even for on-chart gradient updates; the learned weights are interpretable, each feature's coefficient reading directly as its log-odds contribution, so the model can be audited input by input; and regularization handles the correlated features that markets always supply, shrinking redundant weights instead of double-counting shared information. Calibration itself is checked with a reliability diagram, bucketing historical scores and comparing each bucket's predicted probability against its realized frequency, and repaired post-hoc when needed by refitting the score-to-probability map.
That post-hoc role is the concept's second job: logistic calibration is the standard repair for other models' scores. Platt scaling is nothing but a logistic regression fitted on another classifier's outputs, converting overconfident scores from naive Bayesian classifiers or margin-based models into honest probabilities, with isotonic fits as the nonparametric alternative. On-chart implementations span the range, from standalone logistic models over indicator features, through multi-feature versions, to hybrids where a logistic score gates a conventional regime tool, and the online-learning variants update their weights bar by bar.
How to identify logistic calibration in practice
A fitted weighted sum, a sigmoid, and a calibration check: each part is auditable.
- 1Fix the label first: the binary outcome and horizon the score will predict, since every weight is relative to that choice.
- 2Assemble and scale the features, with correlated inputs pruned or regularized rather than left to double-count.
- 3Fit the weights by maximum likelihood under walk-forward discipline, so each period's model only saw its own past.
- 4Check calibration out of sample: bucket the scores, compare predicted probability against realized frequency, and refit the mapping if the curve bows.
- 5Deploy with an explicit consumption rule: a threshold for filtering, or a monotone sizing map, so the graded score does graded work.
How traders use it
- As a signal filter: an underlying setup is taken only when the fitted probability clears a threshold above 0.5, so marginal signals are skipped.
- As a ranking and sizing input: higher scores get priority or larger allocations, while scores hovering near 0.5 are treated as stand-aside conditions.
- As a way to fuse features: several indicator readings are combined through learned weights into one score, a fitted alternative to hand-built sigmoid transforms or fixed-weight scoring.
- As the calibration layer for other models: Platt-style logistic fits map a classifier's raw scores onto honest probabilities, the standard repair for overconfident outputs before they feed sizing.
- In hybrid gates: a logistic score trained on regime features arbitrates when a conventional tool's signals are honored, the construction behind supertrend-plus-logistic style systems.
Logistic calibration vs related learned scorers
Bayesian Classifiers: Naive Bayes counts per-feature likelihoods under an independence assumption and pays with overconfident posteriors; logistic regression learns joint weights that absorb correlation, at the cost of needing optimization. The pairing is standard: Bayes for cheap ranking, logistic to calibrate it.
Neural Networks: A logistic regression is a neural network with no hidden layer: the same sigmoid output over a weighted sum, minus the learned representation. That austerity is the point, fewer parameters, interpretable weights, harder to overfit, and on small trading datasets the austere model is often the better bet.
Sigmoid/Softmax Transforms: The hand-set cousin: squashing an indicator through a sigmoid with chosen center and slope produces a score shaped like a probability without any fitting. Logistic calibration earns the probability interpretation by fitting weights to outcomes; the transform merely borrows the shape.
Concept family
Machine Learning
32 concepts mapped · 32 in the Library
Logistic Signal Calibration FAQ
Turn Logistic Signal Calibration into a trading strategy.
Take the implementation from this page into Quant, then build on it, backtest it on real data, and keep refining it in conversation.