Concept

Long-horizon Calendar Cycles

Long-horizon Calendar Cycles, also known as Benner, presidential, decennial, Kitchin/Juglar, are Time, Sessions & Seasonality concepts. A reference entry: the Library explains it rather than implements it.

What are Long-horizon Calendar Cycles?

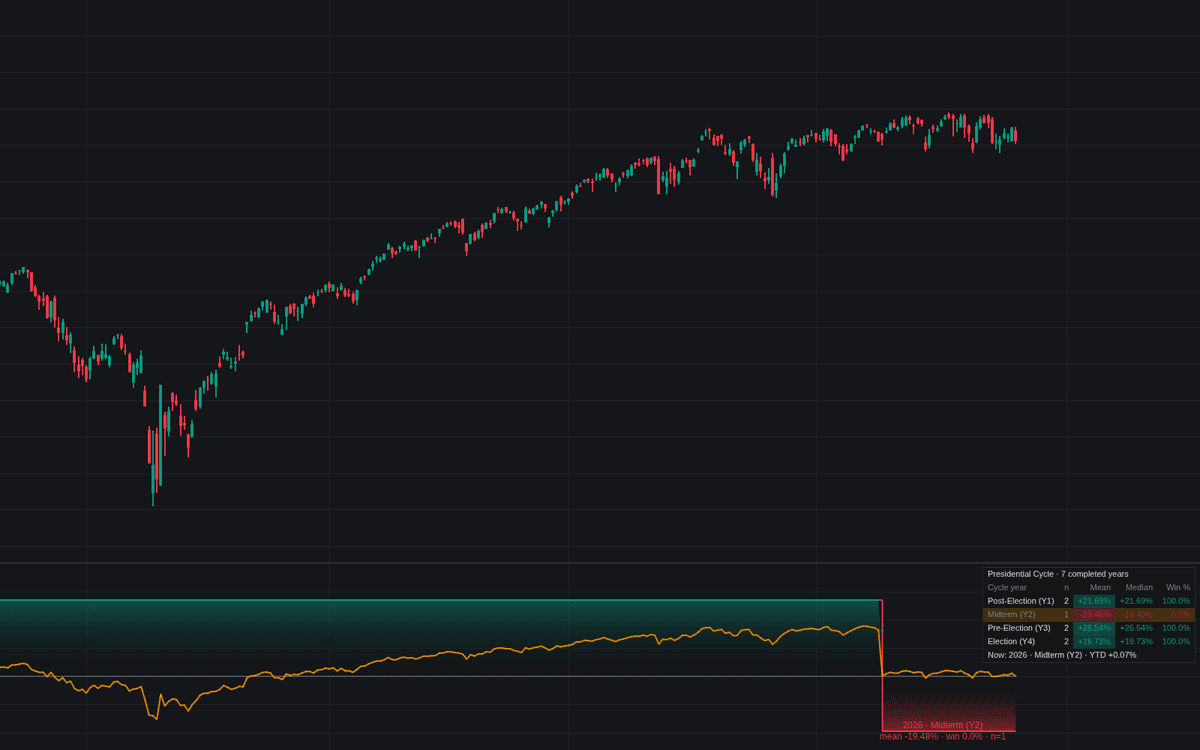
Long-horizon calendar cycles are multi-year market rhythms anchored to the calendar itself rather than measured from price. The family spans Samuel Benner's 1875 chart, which pre-schedules years of highs, lows, and panics at repeating intervals of roughly 8 to 10 and 16 to 20 years; the four-year US presidential cycle; the decennial pattern, which sorts market history by the last digit of the year; and the business-cycle lineage of economists, from Joseph Kitchin's roughly 40-month inventory cycle to Clement Juglar's 7-to-11-year investment cycle and the multi-decade Kondratieff wave. The calendar-anchored members are fixed time cycles in the strict sense: the schedule is known in advance, so the only input is where today falls on it. The business-cycle waves are looser, quoted as approximate lengths rather than exact dates.

The honest caveat is sample size. A four-year cycle repeats only about twenty-five times per century, and the longer waves far fewer, so every average return or scheduled turn year rests on a small number of observations with wide variance around them. Some tendencies have persisted in long US samples (pre-election years, for instance, have historically averaged stronger equity returns), others have blurred or failed after publication, and pre-scheduled panic years land near some real turns and miss others. Practitioners therefore treat calendar cycles as background context or a timing tilt, and reach for price-based tools such as dominant-cycle detection when they need cycles measured from the data instead of the calendar.

The roster's members have distinct pedigrees. Benner was an Ohio farmer ruined in the 1873 panic who worked out repeating intervals in pig-iron prices and panics, publishing a forecast chart that has circulated for a century and a half. The presidential cycle carries an actual mechanism hypothesis, policy and stimulus timed to the electoral clock, which is more than most calendar patterns can claim. The decennial pattern descends from Edgar Lawrence Smith's sorting of market history by the year's final digit, with years ending in five carrying famously strong averages in the older samples. The economists' ladder, Kitchin's inventory swing, Juglar's investment cycle, Kuznets' building cycle, Kondratieff's long wave, was an attempt to give capitalism a nested clockwork, respectable in its day and contested ever since.

Modern use is deliberately modest. The schedules stack into composite calendar views, multi-year position within the presidential and decennial patterns, annual position within month-of-year seasonality, with each layer a small tilt rather than a trigger; blended tools like the Benner-Fibonacci reversal study overlay scheduled years with count-based windows; and every reading defers to live evidence, since a scheduled favorable year means nothing against a tape that disagrees, and calendar slots never suspend the macro event realities that actually move markets on the day.

How to identify calendar-cycle position

The schedules are known in advance; the work is locating today and weighting the answer honestly.

  1. 1Locate the current year on each schedule: presidential-term year, decennial digit, and position within any Benner-style chart in use.
  2. 2Pull the historical record for that slot, average and dispersion both, since a strong mean over a dozen observations deserves its error bars.
  3. 3Mark scheduled turn windows on monthly charts as attention zones, never as standalone triggers.
  4. 4Demand price confirmation inside the windows: structure breaks, breadth shifts, or trend evidence doing the actual signaling.
  5. 5Keep the weight proportionate: calendar position is a tilt applied to sizing and patience, subordinate to live trend and regime evidence.

How traders use it

  • As a multi-month tilt: where the current year sits in the presidential or decennial pattern shifts a longer-term bullish or cautious lean, which still needs confirmation from trend and breadth rather than acting as a trigger on its own.
  • As pre-marked reversal windows: Benner-style charts project specific high and low years decades ahead, and traders drop those years onto weekly or monthly charts as windows to watch for actual reversal behavior, not dates to trade blind.
  • As the top layer of a seasonal stack: multi-year cycles combine with annual effects such as month-of-year seasonality into a composite calendar view of when conditions have historically been favorable.
  • In blended tooling: implementations overlay scheduled Benner years with count-based projections, so a calendar date earning confluence from an independent counting method ranks above either alone.
  • For allocation cadence: longer-horizon investors use cycle position to schedule reviews and rebalancing patience, letting the calendar inform when to be more receptive to evidence rather than what to conclude.

Calendar cycles vs related time frameworks

Fixed Time Cycles: Fixed cycles count constant intervals forward from a chosen price anchor; calendar cycles read position off the civil calendar with no anchor choice at all. The calendar versions are more testable for it, every observer agrees what year it is, and no less fragile in their samples.

Month-of-year Seasonality: Seasonality is the annual floor of the same building: averages by calendar month, refreshed across many years. The long-horizon cycles sit above it with far fewer observations per slot, which is why the annual layer deserves more statistical trust than the multi-year ones stacked on top.

Dominant-cycle Detection: The measured alternative: estimate whatever rhythm the price data currently carries instead of consulting a schedule written in advance. Detection adapts and drifts with the market; calendars never update, which is both their charm and their indictment.

Concept family

Time, Sessions & Seasonality

32 concepts mapped · 32 in the Library

Long-horizon Calendar Cycles FAQ

Is the Benner cycle accurate?

It has landed near some major turns and missed others. With windows that wide and intervals that long, near-misses are easy to find in hindsight, and the chart's record includes clear failures. Most practitioners treat its marked years as low-weight context: a reason to watch price structure more closely, not a signal to act on by itself.

What is the presidential cycle in the stock market?

It is the observation that average US equity returns have historically differed by year of the four-year presidential term, with the pre-election (third) year the strongest on average in long samples. The pattern is an average across a small number of cycles, with wide variance and notable exceptions, so it is context rather than a standalone strategy.

Who was Benner and what was his chart based on?

Samuel Benner was an Ohio hog and iron farmer wiped out in the 1873 panic, who then searched price history for repeating intervals and published Benner's Prophecies of Future Ups and Downs in Prices in 1875. His chart schedules good times, hard times and panic years at alternating intervals, roughly 8-9-10 years for lows and 16-18-20 for panics, projected decades ahead. Its persistence owes more to its audacity than its hit rate, which is genuinely mixed.

What is the decennial pattern?

The habit of sorting market years by their final digit and averaging: in the older long samples, years ending in five posted famously strong average returns, while other digits carried their own reputations. It descends from Edgar Lawrence Smith's work on periodicity. With at most a couple of dozen observations per digit and no mechanism behind the arithmetic, it is the weakest member of the family, quoted more than trusted.

What are the Kitchin, Juglar and Kondratieff cycles?

The economists' ladder of business cycles: Kitchin's roughly 40-month inventory cycle, Juglar's 7-to-11-year fixed-investment cycle, Kuznets' 15-to-25-year building cycle, and Kondratieff's 45-to-60-year long wave of technology and credit. They were serious attempts to periodize capitalism, quoted as approximate lengths rather than calendar dates, and remain contested, the shorter ones better supported than the long wave, whose evidence base is a handful of alleged repetitions.

Do any calendar cycles survive statistical scrutiny?

A few tendencies persist in long samples, pre-election-year strength being the most cited, and even those carry wide variance and post-publication decay, the fate of most published calendar effects. The honest position: these patterns are averages over tiny samples, some with plausible mechanisms and some without, useful as low-weight context and dangerous as convictions. Price-measured cycles and live regime evidence outrank the calendar whenever they disagree.

Build Long-horizon Calendar Cycles your way.

Quant writes, tests, and refines it with you — then it runs on LuxAlgo charting or ports to TradingView.