MACD-V
 By LuxAlgoMar 17, 2026
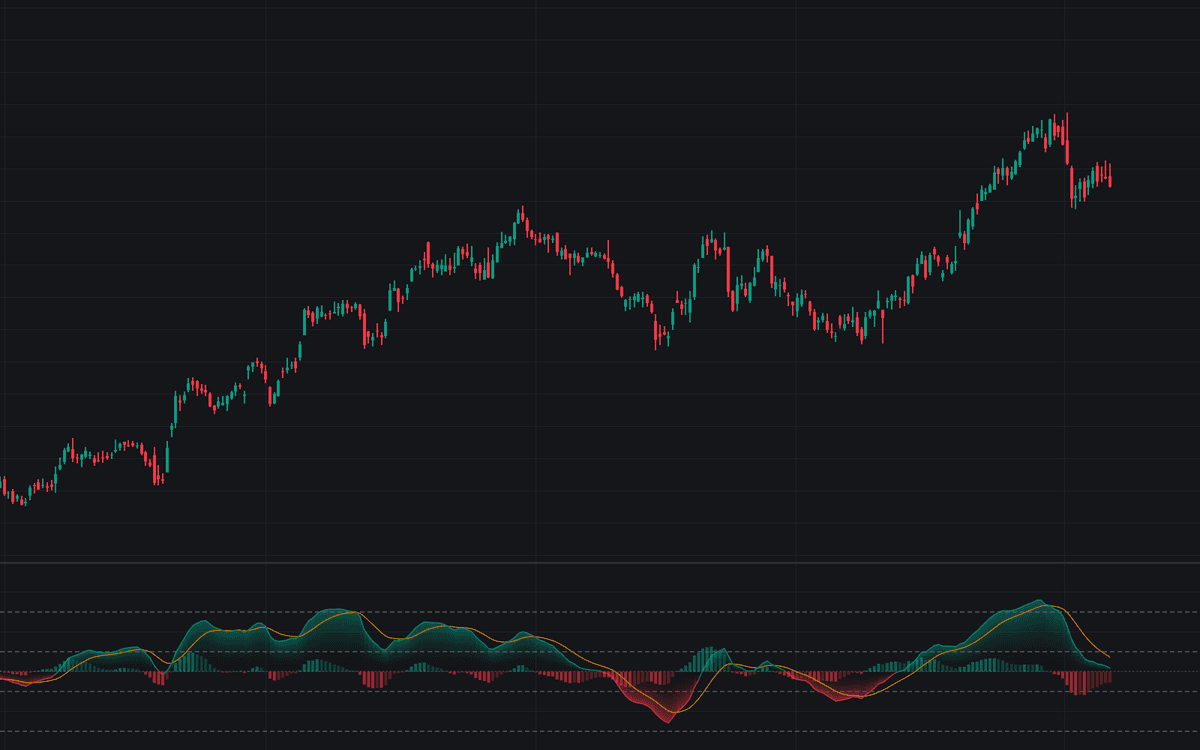

MACD-V restates MACD momentum in volatility units: the 12/26 EMA spread is measured against a 26-period average true range and scaled to a percentage, then given the familiar 9-period signal line plus histogram, a faithful build of Alex Spiroglou's MACD-V. Readings are denominated in the symbol's own volatility, so the pane carries a fixed map: dashed borders at ±50 frame the neutral zone and ±150 the overextension zones, on any symbol or timeframe.
How to Trade the MACD-V?
- Signal cross outside the neutral zone: crosses beyond ±50 are the higher-conviction events; a dedicated alert skips the noise-prone crosses inside the band.
- Zero-line cross: a positive reading puts the fast EMA back on top of the slow one: the momentum side flipped.
- Overextension entry: beyond ±150 a move has outrun its own typical bar: exhaustion risk, not an automatic fade; the unwind back through the border is its own event.
- Histogram shading: bright columns mark a still-widening gap to the signal line, faded columns a gap already narrowing.
The universal scale also makes readings comparable across a watchlist: the same thresholds everywhere, no per-symbol recalibration.
MACD-V Settings
- Source (default close).
- Fast Length (default 12) and Slow Length (default 26): the classic MACD engine.
- ATR Length (default 26): the Average True Range the spread is divided by; the published default matches the slow average.
- Signal Length (default 9): EMA of MACD-V forming the signal line.
- Overextension + / Overextension - (defaults 150 / -150) and Neutral Zone + / Neutral Zone - (defaults 50 / -50): the fixed lifecycle borders.
- Style toggles: Show Histogram (on) and Gradient Fill (on).
Frequently Asked Questions

Original indicatorBuilt in-house by LuxAlgo
The Library is free. Quant makes it yours.
Pull any concept or indicator into Quant: rebuild it, retune it, or turn it into a backtested strategy of your own.