Concept
MACD-V
MACD-V, also known as volatility-normalized MACD, is a Momentum & Oscillators concept. The Library holds 1 implementation, a working definition you can pull into Quant.
volatility-normalized
Top MACD-V indicator
The top custom implementation, built on the original standard MACD-V formula.
1 total
Want to trade MACD-V? The implementation below is one prompt away from a backtested strategy in Quant.
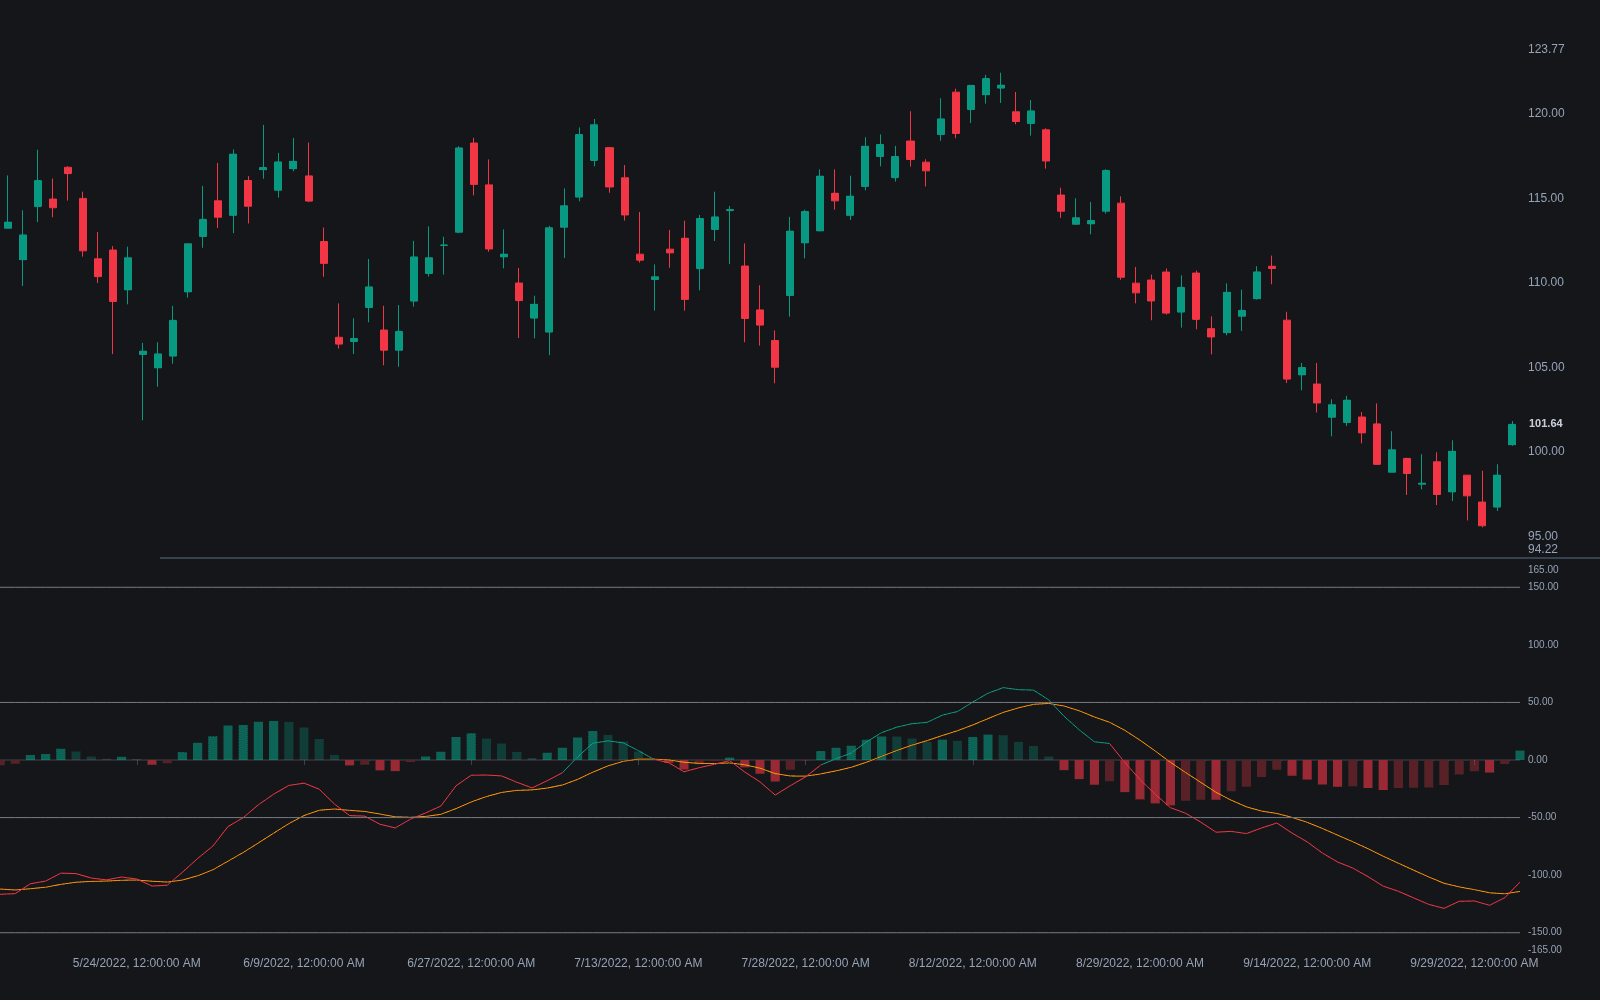
What is MACD-V?
MACD-V is a volatility-normalized MACD proposed by Alex Spiroglou in a 2022 paper. The classic MACD line (12-period EMA minus 26-period EMA) is divided by a 26-period ATR and multiplied by 100, with a 9-period signal line applied to the result. Expressing the spread as a percentage of typical true range fixes raw MACD's core defect: its values are denominated in price, so they cannot be compared across instruments, timeframes, or even different eras of the same chart.
The payoff is a stable, universal scale. Because a given reading means the same thing on any symbol, MACD-V supports fixed reference levels that raw MACD never could: Spiroglou's formulation treats roughly -50 to +50 as a neutral zone and readings beyond ±150 as overextended, layered on top of the familiar zero-line and signal-line events.
Spiroglou's motivation was consistency. A raw MACD reading of 2.5 is meaningless without knowing the symbol and the era: it may be enormous on a low-priced stock and invisible on an index, and even on one chart the same value means different things a decade apart. Dividing by ATR restates the EMA spread in units of the instrument's own typical bar, so momentum becomes a pure number. That turns MACD from a single-chart tool into a framework: the same thresholds and lifecycle vocabulary apply to a currency pair, an index, and a small-cap stock without re-calibration.
The normalization also changes the indicator's character subtly: when volatility expands faster than the EMA spread, readings compress, so MACD-V measures momentum relative to prevailing volatility rather than absolute speed. Everything else carries over from the parent: the 9-period signal line, histogram-style reading of the gap, and zero-line logic work unchanged, with Spiroglou's bands adding a fixed map on top and his lifecycle framing, in which each signal is weighted by the zone it occurs in, as the main practical addition.
How to calculate MACD-V
The construction is the classic MACD with one extra division:
- 1Compute the 12- and 26-period EMAs of price and take their difference; this is the ordinary MACD line.
- 2Divide that difference by the 26-period ATR of the same chart and multiply by 100, restating momentum as a percentage of typical true range.
- 3Apply a 9-period EMA to the normalized line to form the signal line; the gap between the two can be drawn as a histogram.
- 4Mark reference bands at ±50 (neutral border) and ±150 (overextension border); because the scale is normalized, the same lines apply on every symbol.
- 5Read events exactly as with MACD, zero-line and signal-line crosses included, weighting each by the band it occurs in.
How it's calculated
MACD momentum rescaled by average true range so readings are in volatility units and comparable across markets and timeframes.
Introduced by Alex Spiroglou (2022) as volatility normalised momentum; the 12, 26 and 9 lengths mirror classic MACD and the ATR length matches the slow EMA.
Spiroglou reads values above +150 as overbought, below -150 as oversold, and the band between -50 and +50 as ranging with no meaningful trend momentum.
Because of the 100 multiplier, a reading of 100 means the EMA spread equals one full ATR.
How traders use it
- As a cross-market momentum rank: normalized readings can be compared across an entire watchlist to find which instruments carry the strongest momentum relative to their own volatility.
- As a lifecycle map: signal-line crosses are weighted by where they occur; a cross inside the neutral band is treated as noise-prone, while one unwinding from an extreme carries more information.
- As an overbought/oversold framework for a trend-following tool: beyond ±150 a move is stretched relative to its own volatility, which reads as exhaustion risk rather than an automatic fade.
- For divergence work on a consistent scale: regular bullish and bearish divergences are read exactly as on MACD, with the normalization making swing-to-swing comparisons more honest when volatility has shifted between the swings.
- As a signal filter: acting only on signal-line crosses outside the neutral band discards the low-conviction crosses raw MACD users learn to distrust, at the cost of later entries.
- Alongside bounded oscillators: pairing it with RSI or the Stochastic Oscillator separates volatility-adjusted trend momentum from range position, two related but distinct reads on the same move.
MACD-V vs related oscillators
MACD: The parent. Same 12/26 EMA spread and 9-period signal line, but denominated in price, so amplitude depends on symbol and era. MACD-V divides by ATR to make readings portable and fixed levels meaningful.
Volume-weighted MACD: Another MACD variant, but it modifies the input, building the spread from volume-weighted averages, rather than the output scale. The two changes address different weaknesses and are not substitutes.
RSI: Also solves cross-market comparability, but by bounding momentum into 0-100 through its own gain/loss averaging. RSI compresses at extremes; MACD-V stays unbounded, so it can keep registering acceleration where RSI flattens.
CCI: An older expression of the same normalizing instinct: distance from a moving average divided by mean deviation. MACD-V swaps in an EMA spread over ATR, keeping the trend-following genes of MACD rather than CCI's stationary-mean framing.
Concept family
Momentum & Oscillators
91 concepts mapped · 91 in the Library
MACD-V FAQ
Turn MACD-V into a trading strategy.
Take the implementation from this page into Quant, then build on it, backtest it on real data, and keep refining it in conversation.