MACD
 By LuxAlgoApr 13, 2020
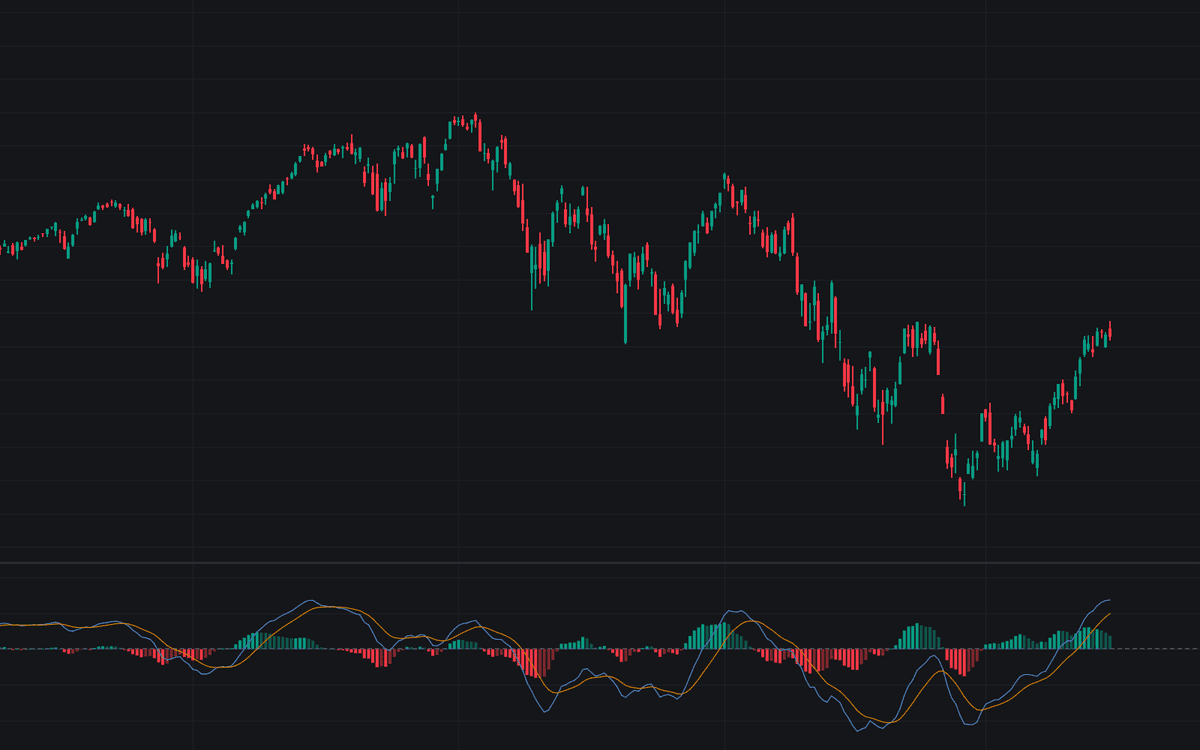

The MACD computes the difference between a fast and a slow exponential moving average of the source, plotting the MACD line together with an EMA signal line and a histogram of the gap between them. Defaults follow the classic 12/26/9 configuration on a selectable source, the standard implementation of Gerald Appel's Moving Average Convergence Divergence with no modifications. The histogram plots as columns shaded four ways (rising and falling bars above zero, rising and falling below), so momentum building or fading is visible at a glance.
How to Trade the MACD?
- MACD crossing above the Signal line: momentum turning up relative to its own recent path, the fastest of the classic line-based triggers.
- MACD crossing below the Signal line: the mirrored bearish trigger, often read as a momentum exit.
- Zero-line crosses: the slow read. Above zero the fast EMA sits above the slow one, a regime statement rather than a timing signal.
- Histogram shrinking toward zero: the earliest warning, showing the gap between MACD and Signal narrowing before any crossover prints.
- Divergence with price: a new price extreme the MACD line declines to confirm questions the momentum behind the move.
MACD Settings
- Fast Length (default 12): length of the fast EMA. Shorter speeds every signal and every whipsaw alike.
- Slow Length (default 26): length of the slow EMA anchoring the spread.
- Signal Smoothing (default 9): EMA applied to the MACD line to obtain the signal line. Lower fires crossovers earlier, higher filters them.
- Source (default close): price series used to compute the fast and slow EMAs.
Alerts
Bullish Cross and Bearish Cross alert conditions track signal-line crossings, while Bullish Zero Cross and Bearish Zero Cross track the MACD line's crossings of the zero level.
Frequently Asked Questions

The Library is free. Quant makes it yours.
Pull any concept or indicator into Quant: rebuild it, retune it, or turn it into a backtested strategy of your own.