Market Structure & Fibonacci Zones + RR

by LuxAlgo · Jul 6, 2026

Static chart image
Drawing Tool
Fibonacci

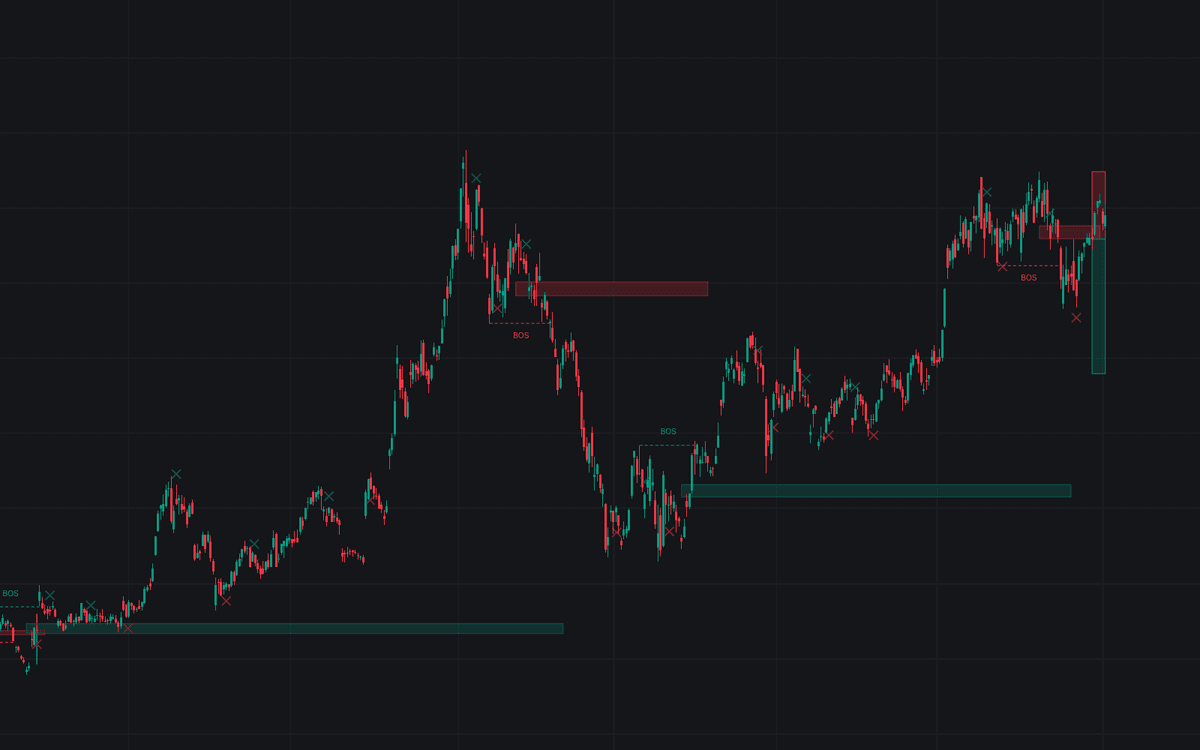
The Market Structure & Fibonacci Zones + RR indicator provides a systematic way for traders to identify market structure breaks and potential reversal zones while automatically calculating risk and reward parameters for trade management. By combining pivot-based trend identification with golden pocket Fibonacci retracements, the tool helps traders visualize entry, stop loss, and take profit levels directly on the chart.

Usage

The indicator works by scanning price action for key pivot points to establish trend direction. When a break of structure (BOS) occurs, the script projects a specific Fibonacci zone where price action can be monitored for potential trend continuation or exhaustion.

Identifying Market Structure

The script detects bullish and bearish breaks of structure based on the selected term length. When a higher high is broken during an uptrend, or a lower low is broken during a downtrend, a BOS label and line are generated to highlight the ongoing momentum.

Fibonacci Zones

Upon a confirmed BOS, the tool plots a Fibonacci box ranging from the 50% to the 61.8% level. These zones are intended to act as points of interest where price may retrace before continuing the original trend. The zone remains active until the price interacts with it and satisfies the entry conditions.

Trade Management

Once the price enters the Fibonacci zone and confirms a setup, the script automatically draws a risk and reward box. This visual aid displays where the stop loss is placed (at the origin of the trend) and where the take profit level is set based on your specified risk to reward ratio.

Details

The script is built using Pine Script pivot functions to define significant highs and lows. It maintains an internal state to track the current trend and whether a setup has been mitigated or triggered.

  1. Trend Tracking: It uses pivot high and pivot low detection to determine whether the market is shifting.
  2. Logic Execution: Once a BOS is identified, the indicator stores the origin of the move and calculates the retracement levels (50% to 61.8%) to construct the active trading zone.
  3. Execution Logic: The trade is only triggered when the price returns into the Fibonacci box and shows signs of reversal (such as a candle closing in the direction of the trend), ensuring that you are entering trades with improved confirmation.

Settings

General Settings

  • Market Structure Term: Determines the sensitivity of the pivot detection. Choosing Short, Mid, or Long adjusts the number of bars used to confirm a pivot point, allowing you to tailor the indicator to your specific trading timeframe.
  • Show Only Valid Setups: When enabled, the indicator will clean up the chart by removing previous, non-triggered setups to keep your workspace clear for active opportunities.
  • Risk/Reward Ratio: Defines the target multiplier for your trades. Setting this to 2.0, for example, will place your take profit at twice the distance of your stop loss.

Style

  • Bullish Color: Customizes the visual elements for buy setups, such as BOS lines and Fibonacci boxes.
  • Bearish Color: Customizes the visual elements for sell setups to help distinguish between market directions.

FAQ

How do I interpret the Fibonacci box?

The Fibonacci box represents the "Optimal Trade Entry" zone. Traders typically look for the price to pull back into this area before looking for signs of a continuation of the previous market structure break.

Can I change the sensitivity of the BOS signals?

Yes, by adjusting the Market Structure Term input, you can switch between Short, Mid, and Long settings. Short provides more frequent signals for scalping, while Long is better suited for identifying major market trends.

How to access Market Structure & Fibonacci Zones + RR?

You can get access on the LuxAlgo Library for charting platforms like TradingView, MetaTrader (MT4/MT5), and NinjaTrader for free.

Free access on the following platforms
tradingviewSymbolTradingView
Open in your browser

This in-app browser is not compatible with Get Access from the library.

Tap the menu (...) at the top of your screen and select "Open in Browser", "Open in Safari", or "Open in Chrome" to continue.

ninjatraderNinjaTrader
Open in your browser

This in-app browser is not compatible with Get Access from the library.

Tap the menu (...) at the top of your screen and select "Open in Browser", "Open in Safari", or "Open in Chrome" to continue.

metatrader4MetaTrader 4/5
Open in your browser

This in-app browser is not compatible with Get Access from the library.

Tap the menu (...) at the top of your screen and select "Open in Browser", "Open in Safari", or "Open in Chrome" to continue.

thinkorswimThinkorswim
Open in your browser

This in-app browser is not compatible with Get Access from the library.

Tap the menu (...) at the top of your screen and select "Open in Browser", "Open in Safari", or "Open in Chrome" to continue.

Trading & investing are risky and many will lose money in connection with trading and investing activities. All content on this site is not intended to, and should not be, construed as financial advice. Decisions to buy, sell, hold or trade in securities, commodities and other investments involve risk and are best made based on the advice of qualified financial professionals. Past performance does not guarantee future results.

Hypothetical or Simulated performance results have certain limitations. Unlike an actual performance record, simulated results do not represent actual trading. Also, since the trades have not been executed, the results may have under-or-over compensated for the impact, if any, of certain market factors, including, but not limited to, lack of liquidity. Simulated trading programs in general are designed with the benefit of hindsight, and are based on historical information. No representation is being made that any account will or is likely to achieve profit or losses similar to those shown.

Testimonials appearing on this website may not be representative of other clients or customers and is not a guarantee of future performance or success.

As a provider of technical analysis tools and strategies, we do not have access to the personal trading accounts or brokerage statements of our customers. As a result, we have no reason to believe our customers perform better or worse than traders as a whole based on any content, tool, or platform feature we provide.

Charts used on this site are by TradingView in which the majority of our technical indicators are built on. TradingView® is a registered trademark of TradingView, Inc. www.TradingView.com TradingView® has no affiliation with the owner, developer, or provider of the Services described herein.

Market data is provided by CBOE, CME Group, BarChart, Massive, CoinAPI. Select U.S. equities data is provided through Massive. CBOE BZX real-time U.S. equities data is licensed from CBOE and provided through BarChart. Real-time futures data is licensed from CME Group and provided through BarChart. Select cryptocurrency data, including major coins, is provided through CoinAPI. All data is provided “as is” and should be verified independently for trading purposes.

This does not represent our full Disclaimer. Please read our full disclaimer.

© 2026 LuxAlgo Global, LLC.