MLMA
 By LuxAlgoJun 19, 2026
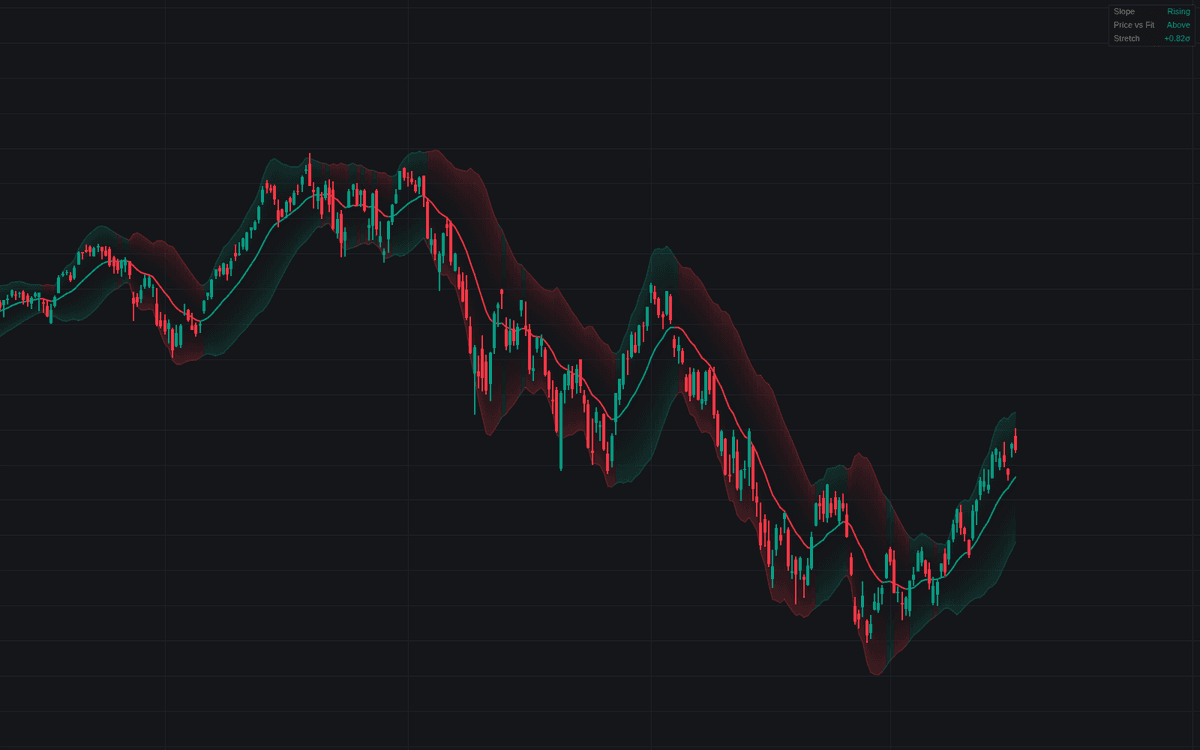

MLMA is a rigorous take on the machine learning moving average: a causal Nadaraya-Watson kernel regression with a Gaussian kernel fits the last 100 bars, and the fitted mean plots as an adaptive smoother wrapped in uncertainty bands at 2.0 residual standard deviations. Every estimate uses the current and prior bars only, so plotted history never repaints. The bands swell where the model struggles to explain recent prices and pull in where it accounts for them, and a dashboard reports slope, price's side of the fit and stretch in σ units.
How to Trade the MLMA?
- Slope color flips: the line paints by its own slope (the directional-bias read) with slope-turn alerts on each change.
- Price crosses the fitted mean: the regime read; optional triangles mark the crossings.
- Band breakout: a push beyond either band is stretch the model cannot explain: momentum or extreme, depending on context.
- Band reversion: crossing back inside the envelope starts the reversion read toward the fitted mean.
The model-driven envelope serves trend and reversion styles alike, a signature shared across the machine learning toolkit.
MLMA Settings
- Source (default close).
- Window Length (default 100): bars the model sees; longer smooths and lags more, shorter hugs price and risks fitting noise.
- Kernel Bandwidth (default 8.0): how quickly a bar's weight decays with age, the role length plays for an EMA.
- Show Uncertainty Bands (default on) with Band Multiplier (default 2.0): envelope distance in residual standard deviations.
- Show Dashboard (default on).
- Style toggles: Slope Trend Coloring (on), Uncertainty Gradient Fill (on), Price Crossing Markers (off).
Frequently Asked Questions

The Library is free. Quant makes it yours.
Pull any concept or indicator into Quant: rebuild it, retune it, or turn it into a backtested strategy of your own.