Concept
MLMA
MLMA, also known as machine learning moving average, is a Trend concept. The Library holds 1 implementation, a working definition you can pull into Quant.
LuxAlgo
Top MLMA indicator
The top custom implementation, built on the original standard MLMA formula.
1 total
From studying MLMA to trading it: take the implementation below into Quant and backtest it instantly.
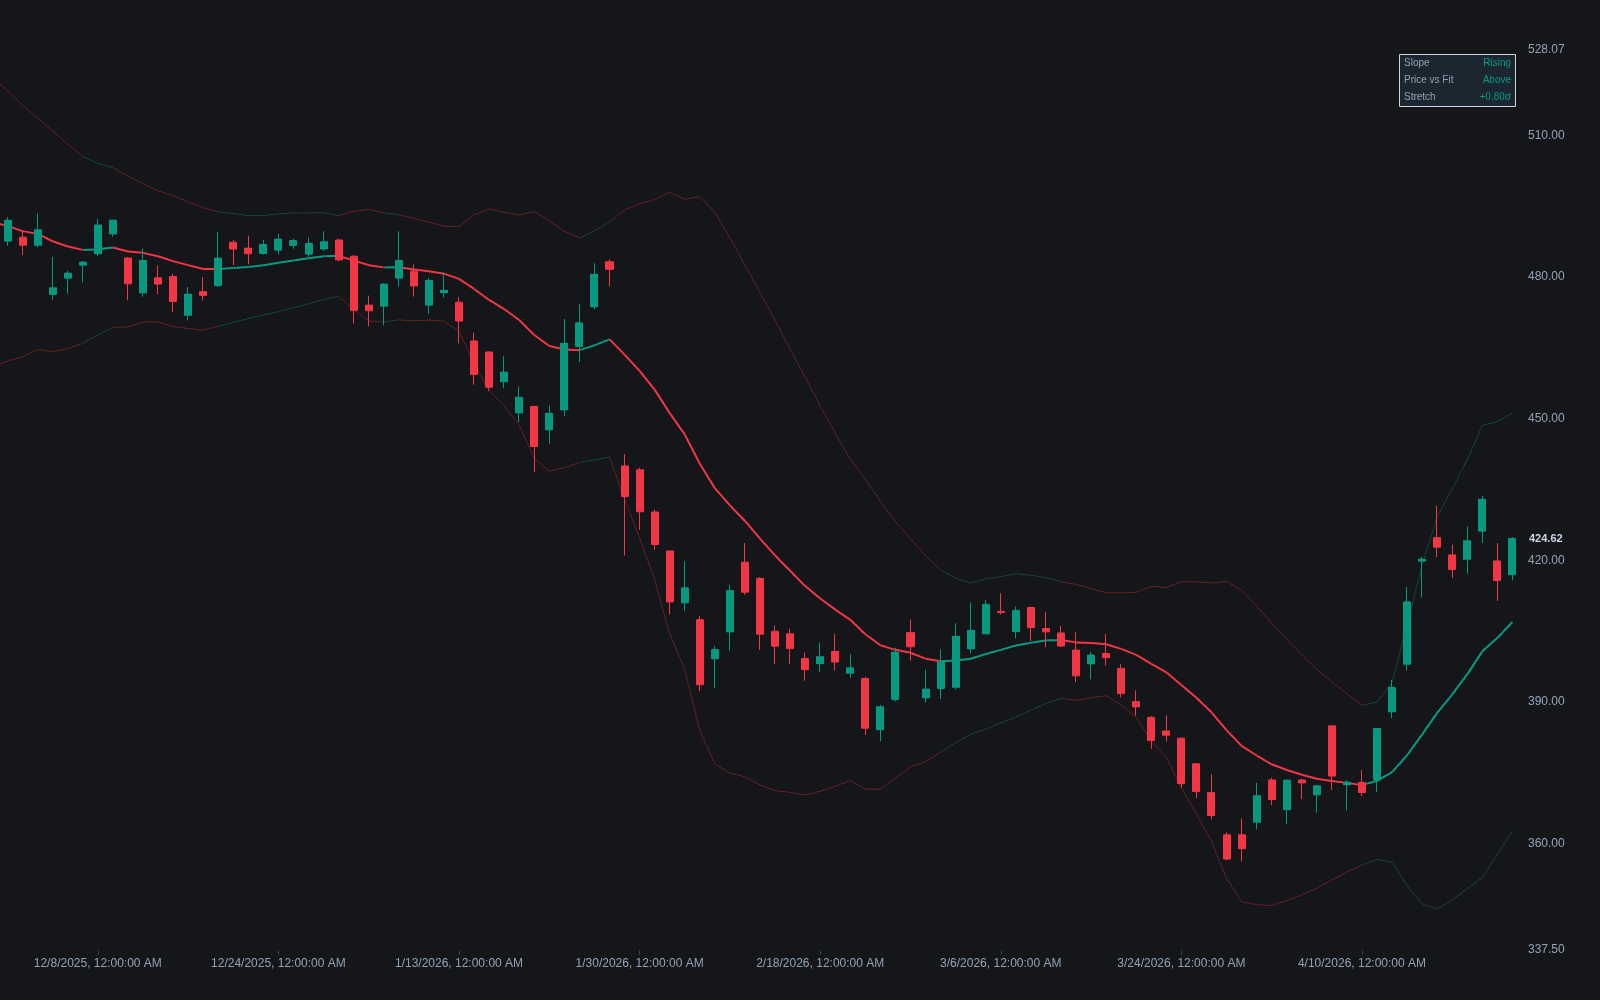
What is the MLMA?
MLMA stands for Machine Learning Moving Average: a smoothing line whose value comes from fitting a statistical learning model to recent prices instead of applying a fixed weighting scheme. Where an SMA weights every bar equally and a WMA fixes a linear ramp, an MLMA typically runs kernel regression over the lookback window, often with a radial basis function kernel, a construction closely related to Gaussian process regression, and plots the model's fitted estimate of the underlying value bar by bar. The output behaves like a flexible weighted average: smooth, locally adaptive, and able to bend with curvature that fixed-weight averages round off. Implementations commonly add bands derived from the model's uncertainty or residual dispersion.
The underlying mathematics is older than the branding. Kernel-weighted local averaging goes back to the Nadaraya-Watson estimator published in 1964, and Gaussian process regression is a standard tool in modern statistics; what charting communities did was package these fits as a price overlay and name the result a machine learning moving average. Two inputs do most of the work: the window, which sets how much history the model sees, and the kernel bandwidth, which sets how quickly a bar's influence decays, together controlling the smoothness-versus-responsiveness tradeoff the way length does for an EMA. Viewed this way, familiar averages are just fixed kernels, an EMA being an exponential-decay kernel, and the MLMA generalizes the idea by letting the kernel be chosen and, in some versions, tuned.
Machine learning here means a fitted model, not foresight. The line is still a function of past prices, so it lags at turns like any smoother, and the flexibility cuts both ways: a model that bends easily can overfit the window it sees. The other engineering concern is repainting: kernel fits that weight a centered window revise their recent history as new bars arrive, so historical plots can flatter what was actually tradeable. Repaint-safe engineering restricts the fit to one-sided, causal windows and finalizes values on bar close.
The name is a community label rather than an academic category, and implementations vary between script authors, so two indicators called MLMA can behave quite differently. Conceptually the MLMA belongs to the adaptive-smoother lineage alongside the adaptive-lookback MA and the Ehlers SuperSmoother: all pursue less lag for a given smoothness than fixed-weight averages allow. What the kernel approach adds is a principled uncertainty estimate, which is why MLMA implementations so often ship with bands, effectively a model-driven MA envelope whose width adapts to how noisy the recent fit is.
How to identify an MLMA on a chart
An MLMA plots as a smooth overlay line, usually with optional bands, and reads like any moving average once its parameters are understood.
- 1Apply a kernel or machine-learning moving average indicator and locate its two key inputs: window length and kernel bandwidth (Gaussian process variants add a noise term).
- 2Read the line like a smoother: slope and color for directional bias, price's side of the line for regime, and curvature for how the trend is bending.
- 3If bands are plotted, note what they encode: distance from the fitted mean scaled by model uncertainty or residual dispersion, widening when recent prices fit the model poorly.
- 4Test for repainting before trusting history: watch whether the last few plotted values shift as new bars close, or step through bar replay; a causal implementation's past stays fixed.
- 5Benchmark against a conventional average of similar smoothness: the kernel fit should track curvature through turns that the fixed-weight line rounds off, with comparable noise rejection.
How traders use it
- In the standard moving-average roles: slope or color for trend bias, price's side of the line for regime, and crossovers against a faster line for timing.
- As an adaptive envelope: the model's uncertainty bands frame how stretched price is from the fitted mean, supporting reversion and breakout reads that fixed-percentage envelopes handle crudely.
- As a smoothness upgrade in existing systems: swapping a fixed-weight average for a kernel-based one where the goal is less lag for a given smoothness, verified on closed-bar behavior.
- As dynamic support and resistance: in a trending regime, pullbacks to the fitted line are watched for reactions, the same playbook as dynamic S/R via MA, with the band edges serving as the deeper zone.
- As a regime gate for other systems: the line's slope, thresholded like an MA slope filter, or price's side of it can switch a strategy between breakout logic and mean-reversion logic.
MLMA vs other trend smoothers
EMA: An EMA is a fixed exponential-decay kernel: one parameter, fully causal, never repaints, and cheap to compute. The MLMA generalizes the weighting and can track curvature better, at the cost of more parameters, heavier computation, and implementation-dependent repainting risk.
Adaptive-lookback MA: Adaptive moving averages keep a simple weighting scheme but vary the effective length with market conditions. The MLMA instead changes the weighting function itself via a kernel fit. Both chase the same goal, responsiveness in trends and smoothness in chop, by different routes.
Ehlers SuperSmoother: The SuperSmoother is a fixed digital filter designed from signal-processing principles to suppress short-wavelength noise with minimal lag. It is deterministic and parameter-light, while the MLMA is a statistical fit whose behavior depends on kernel and window choices.
Supertrend: Supertrend is a stepped, volatility-offset trailing line built for unambiguous flip signals, not a smoother of price. An MLMA estimates the local mean and bends continuously; Supertrend rides at an ATR distance and only flips sides. They answer different questions and are often layered together.
Concept family
Trend
100 concepts mapped · 100 in the Library
MLMA FAQ
Turn MLMA into a trading strategy.
Take the implementation from this page into Quant, then build on it, backtest it on real data, and keep refining it in conversation.