Negative Volume Index
 By LuxAlgoJan 30, 2026
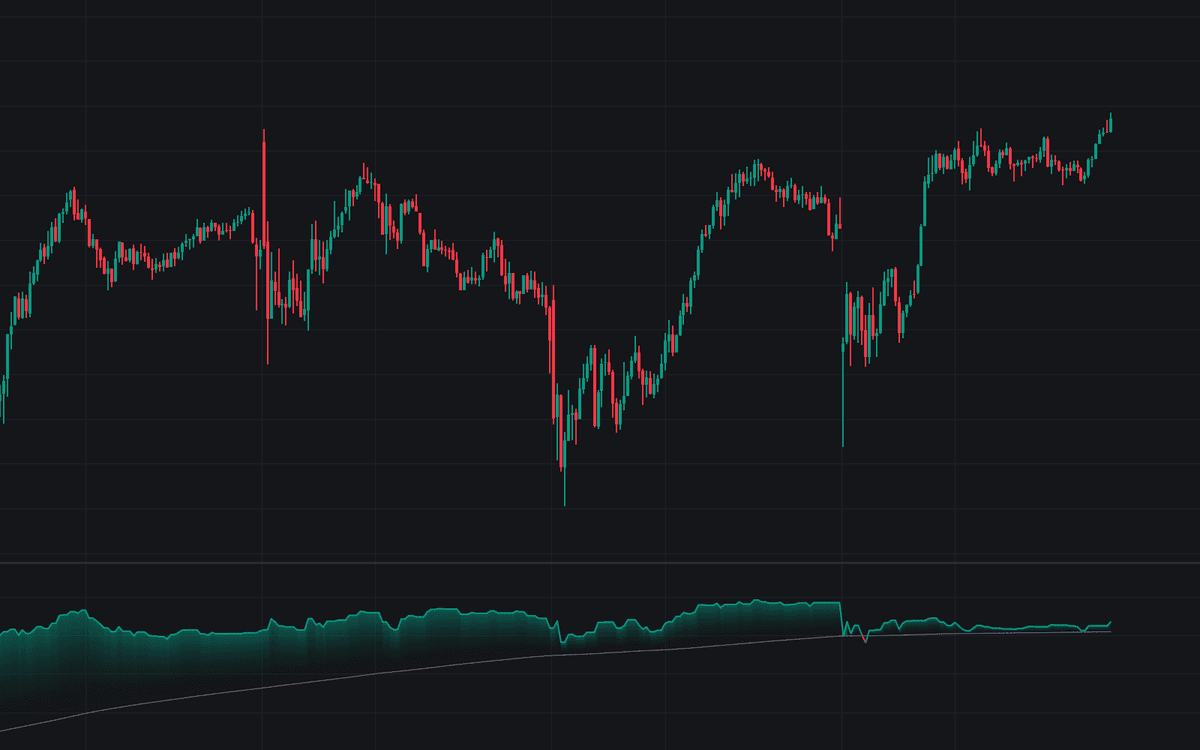

Negative Volume Index isolates what price does when the crowd goes quiet. The Negative Volume Index is a cumulative line that moves only on bars whose volume prints below the prior bar's, compounding by that session's percentage close-to-close change; equal- or rising-volume sessions leave it flat. The line seeds at an arbitrary 1000 (the absolute level carries no information) and is read through its slope and its standing relative to a long EMA of itself, the conventional one-year signal. The build colors the line by that regime, fills the gap to the average with a gradient, and alerts on both crosses.
How to Trade the Negative Volume Index?
- NVI above its signal EMA: quiet-session price behavior supports the primary trend, the classic constructive configuration.
- NVI below its signal EMA: quiet days lean toward distribution, the caution regime.
- Signal crosses: the Bullish and Bearish Signal Cross alerts mark regime changes; they are infrequent by design.
- Gradient depth: the fill strengthens with the distance between line and average, so the conviction of the current regime reads at a glance.
This is deliberately a slow instrument: it describes the backdrop and is not meant to time entries on its own.
Negative Volume Index Settings
- Base Level (default 1000): seed of the cumulative line; only sets the scale of the numbers.
- Signal EMA (default on, length 255): the conventional one-trading-year average. Hiding it removes only the plotted overlay. Coloring, fill, and alerts still use it.
- Line Coloring (default Position vs Average): regime coloring, or a single neutral color.
- Gradient Fill (default on): the regime fill between line and average.
- Color inputs set the bullish, bearish, neutral, and signal EMA colors.
Frequently Asked Questions

The Library is free. Quant makes it yours.
Pull any concept or indicator into Quant: rebuild it, retune it, or turn it into a backtested strategy of your own.