Concept
Negative Volume Index
Negative Volume Index is a Volume & Order Flow concept. The Library holds 1 implementation, a working definition you can pull into Quant.
NVI
Top Negative Volume Index indicator
The top custom implementation, built on the original standard Negative Volume Index formula.
1 total
From studying Negative Volume Index to trading it: take the implementation below into Quant and backtest it instantly.
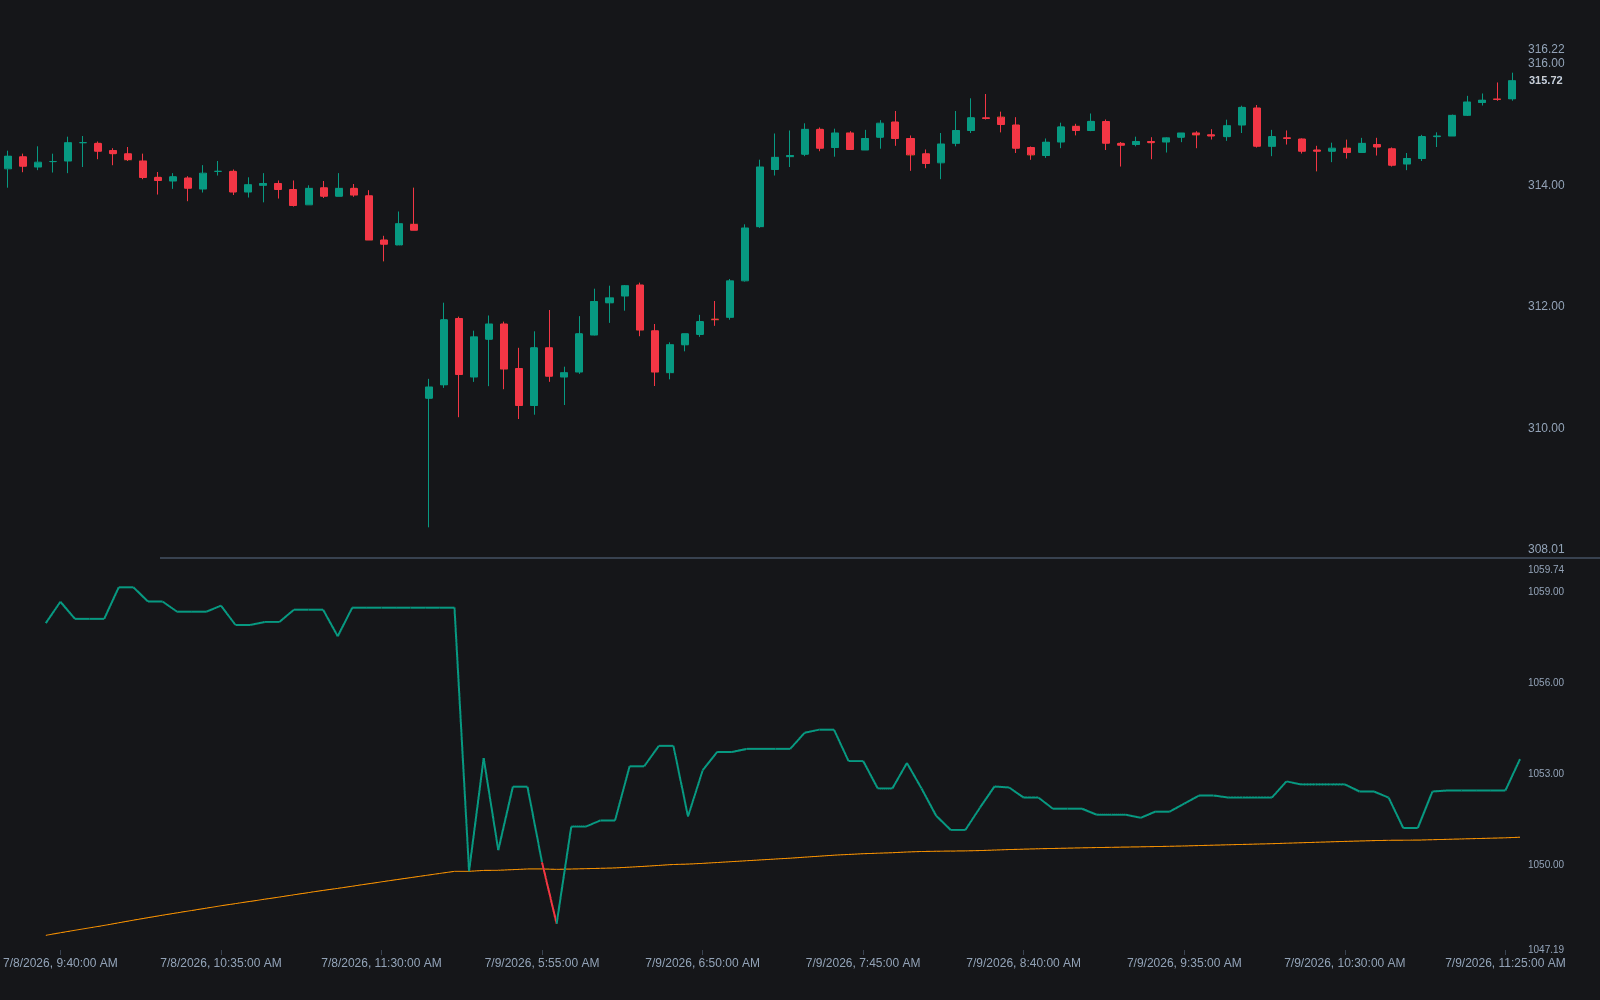
What is the Negative Volume Index?
The Negative Volume Index (NVI) is a cumulative line that changes only on sessions when volume falls below the prior session's volume. On those quiet days the line moves by the day's percentage price change; on rising-volume days it stays flat. Created by Paul Dysart in the 1930s and refined by Norman Fosback in 1976, it rests on one premise: the crowd trades the loud days while informed money positions on the quiet ones, so price behavior on falling-volume days is worth isolating.
The absolute level is arbitrary (the line is usually seeded at 1000), so NVI is read by slope and by position against a long average of itself, conventionally a one-year (255-day) EMA. Above the average is treated as a healthy primary trend; below it, as quiet-day distribution. It is a slow, regime-scale tool rather than a timing signal.
The history explains the two versions in circulation. Dysart built his index in the 1930s from advance-decline data on falling-volume days; Fosback's 1976 book Stock Market Logic redefined it on percentage price change and popularized the one-year-average signal, reporting very high historical odds of a bull market when NVI sat above that average. Those hit rates came from mid-century index data, and later replications find the edge smaller and period-dependent, so the honest reading is that the above-average condition has historically been a decent description of healthy primary trends, not a forecast with printed odds.
Modern practice keeps NVI in the slow lane and mostly on broad indices, where day-to-day volume comparisons mean something; single names and thin markets add noise the premise cannot carry, and its quiet-day definition, yesterday's volume versus today's, is a cruder cut than relative volume baselines. The design also lives on inside composites: DonovanWall's Dual Volume Divergence Index derives positive and negative volume flows in the NVI tradition and reads their disagreements with price as volume divergence, turning a 1930s regime line into an oscillator with modern smoothing.
How to identify the Negative Volume Index on a chart
NVI is defined by what it ignores. Reading it is mostly about respecting that filter and the slow timescale it implies.
- 1Each session, compare volume with the prior session; only sessions with lower volume are allowed to move the line.
- 2On those quiet sessions, multiply the line by one plus the day's percentage price change; on all other sessions carry it flat.
- 3Overlay the conventional signal: a one-year (255-day) EMA of the line itself.
- 4Read regime, not wiggles: position above or below the long average and the slope of the line are the outputs; day-to-day changes are noise by construction.
- 5Cross-check against the mirror series and a cumulative all-days line such as OBV, since agreement across volume lines is the classic stronger read.
How it's calculated
A cumulative index that moves only on lower-volume days, tracking how price behaves when activity dries up.
Paul Dysart's 1930s original accumulated raw changes on lower-volume days; Norman Fosback's percent-change form shown here is the modern standard.
Fosback read NVI above its one-year EMA as strong evidence of a bull market in force.
Pairs with the Positive Volume Index, which updates only when volume rises.
How traders use it
- As a long-horizon trend filter: NVI above its one-year EMA supports a bullish bias, and a cross below is a caution flag that gains weight when other breadth or volume evidence agrees.
- Paired with the Positive Volume Index: NVI rising while PVI stalls is read as accumulation without crowd participation, and the two agreeing (both above or both below their averages) is the stronger classic configuration.
- As a divergence input: NVI trending down while price makes new highs flags that quiet-day flows are leaning against the tape, the same logic as OBV Divergence applied to a filtered subset of days.
- As the slow layer in volume dashboards: a regime line checked weekly beside faster per-bar flow reads, where its job is context rather than triggers.
- As an engine inside derived oscillators: the Dual Volume Divergence Index builds NVI-style and PVI-style flows, smooths them, and flags their divergences against price, trading the concept at oscillator speed.
Negative Volume Index vs other volume lines
OBV: OBV moves every session, adding or subtracting the whole day's volume by the sign of the close. NVI ignores most days entirely and accumulates percentage price change only when volume fell. One is a running vote of all activity; the other deliberately listens to the quiet minority of days.
Positive Volume Index: The exact mirror: PVI updates only on rising-volume days, tracking what the crowd does when activity expands. Fosback read NVI as the informed series and PVI as the crowd series, and treated agreement between the two, both above or both below their yearly averages, as the strongest configuration.
Money Flow Index: MFI is a bounded 0-100 oscillator weighting typical price by volume over a short window, built for overbought and oversold reads. NVI is an unbounded cumulative line read against a one-year average. They share the volume input and nothing else: one times swings, the other describes regimes.
Concept family
Volume & Order Flow
88 concepts mapped · 88 in the Library
Negative Volume Index FAQ
Turn Negative Volume Index into a trading strategy.
Take the implementation from this page into Quant, then build on it, backtest it on real data, and keep refining it in conversation.