Positive Volume Index
 By LuxAlgoJun 2, 2026
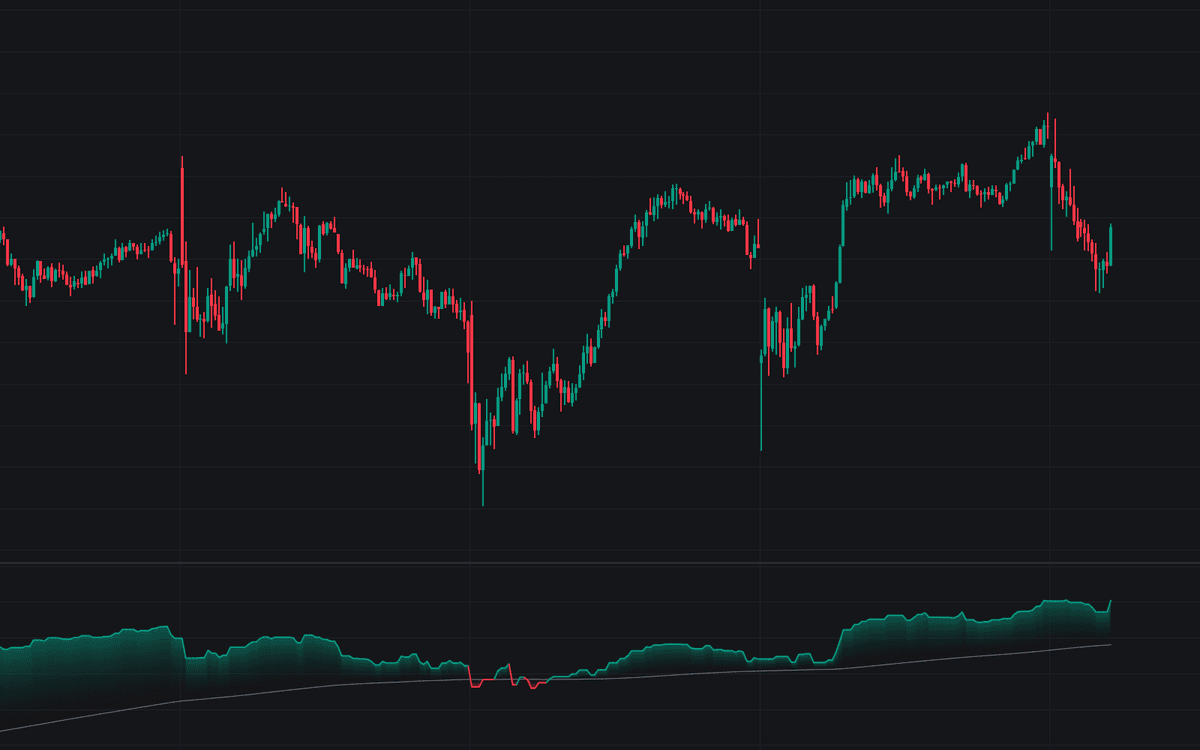

Positive Volume Index isolates what price does on the crowd's days: the line compounds by the bar's percentage change only when volume rises above the previous session's, and holds flat on every other bar. The definitive clean build of the Positive Volume Index seeds the line at 1000, pairs it with the long signal EMA that anchors the classic regime read, and colors everything by that regime: bullish while PVI holds above its average, bearish below it, neutral before the average has formed.
How to Trade the Positive Volume Index?
- PVI above its signal EMA: high-participation sessions are trending above their own long-run norm, the classic bullish environment read, with an alert on the cross above.
- PVI below its signal EMA: the bearish environment, alerted on the cross below.
- Slope turns: PVI only moves on rising-volume sessions, so a turn in the line marks the latest high-participation day changing sides; turned-rising and turned-falling each alert.
The line's absolute level carries no information (it depends on the seed and where data begins), so the reads are slope and position against the average. PVI is slow by construction and suits regime filtering over trade timing.
Positive Volume Index Settings
- Source (default close): series whose one-bar percentage change moves the line on active sessions.
- Starting Value (default 1000): seed of the cumulative line; it shifts the level without changing any read.
- Signal EMA (default enabled, length 255): the long average behind the regime read, roughly a trading year on daily charts; hiding it keeps the coloring, fill, and alerts, all measured against it.
- Gradient Fill (default enabled): shading between PVI and its average, strongest at the PVI value; remaining Style inputs set colors.
Frequently Asked Questions

The Library is free. Quant makes it yours.
Pull any concept or indicator into Quant: rebuild it, retune it, or turn it into a backtested strategy of your own.