OBV Divergence
 By LuxAlgoMay 17, 2026
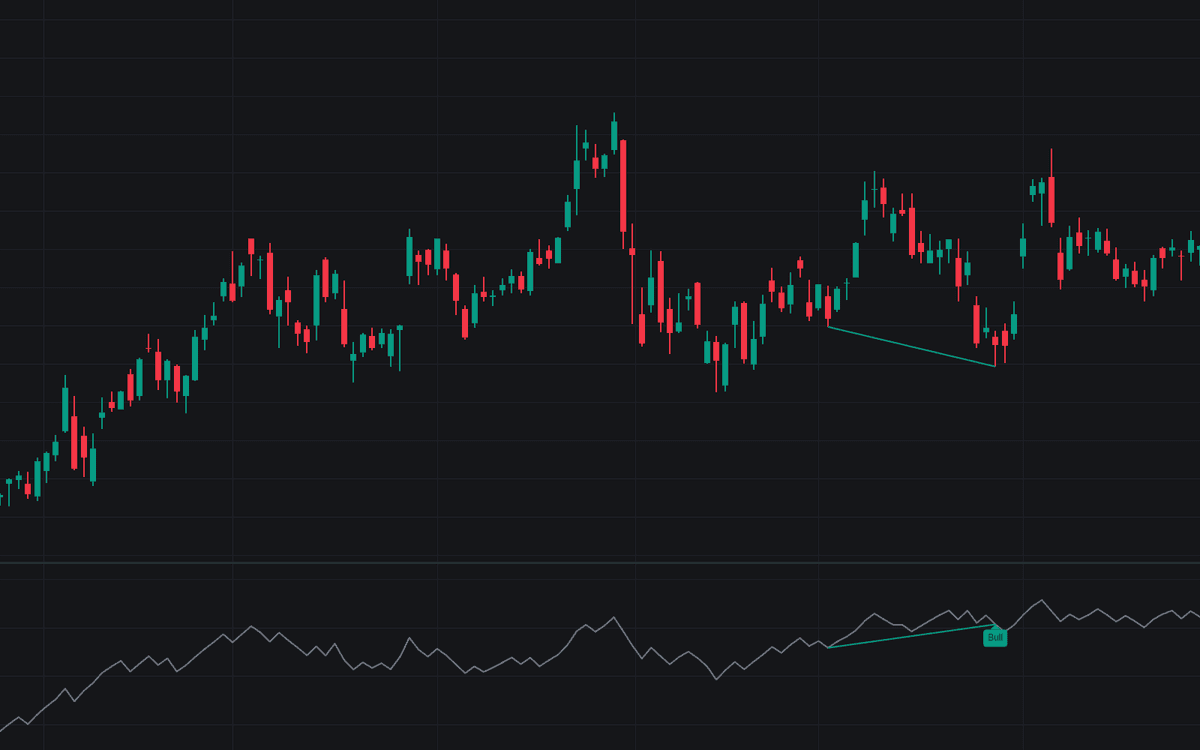

OBV Divergence watches for the moments when price and cumulative volume stop telling the same story. It plots On-Balance Volume (the running total adding a bar's volume on up closes and subtracting it on down closes) and compares its swings against price swings at confirmed pivots, flagging every OBV divergence with paired lines in the pane and on the price chart. A higher price high met by a lower OBV high shows an advance drawing thinner volume backing; a price low undercutting the prior one while OBV holds higher shows sellers losing force.
How to Trade the OBV Divergence?
- Bear label: price higher high, OBV lower high: a warning over the advance, traded once price structure breaks rather than on the label alone.
- Bull label: price lower low, OBV higher low: the accumulation-flavored counterpart, same discipline.
- Hidden divergences (optional, dashed): price holding a higher low while OBV prints a fresh low, and the bearish inverse: continuation reads rather than reversals.
- Audit both panes: the paired lines show exactly which two swings produced each signal, a habit worth keeping across the volume tools.
All four divergence types carry dedicated alerts.
OBV Divergence Settings
- Left Bars (default 5) and Right Bars (default 5): bars required on each side of a price swing; the right side sets the confirmation delay.
- Max Bars Between Swings (default 60): swings further apart are not treated as part of the same move and are never compared.
- Detect Hidden Divergences (default off): add the continuation variants, a comparison more familiar from oscillators than from OBV.
- Style inputs toggle the OBV-pane lines, the price-chart lines, and the signal labels, plus the bullish, bearish, and OBV line colors.
Frequently Asked Questions

Original indicatorBuilt in-house by LuxAlgo
The Library is free. Quant makes it yours.
Pull any concept or indicator into Quant: rebuild it, retune it, or turn it into a backtested strategy of your own.