Concept
OBV Divergence
OBV Divergence is a Volume & Order Flow concept. The Library holds 1 implementation, a working definition you can pull into Quant.
Top OBV Divergence indicator
The top custom implementation, built on the original standard OBV Divergence formula.
1 total
Want to trade OBV Divergence? The implementation below is one prompt away from a backtested strategy in Quant.
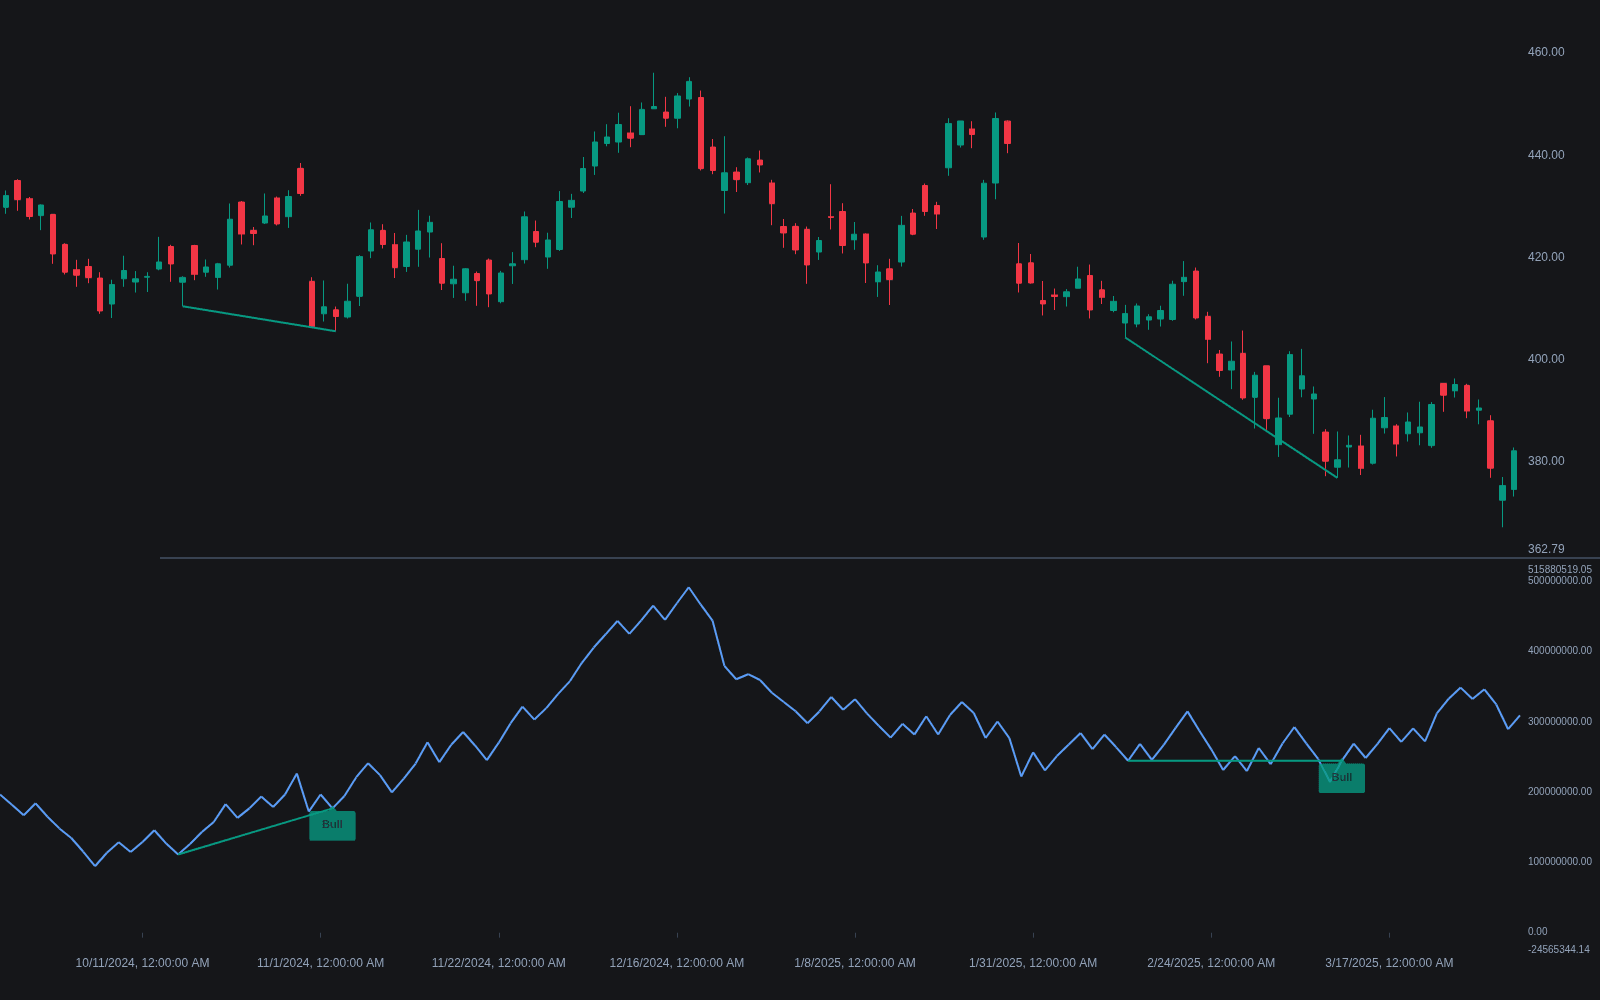
What is OBV Divergence?
OBV divergence is a disagreement between price and On-Balance Volume, the running total that adds a bar's entire volume when it closes above the prior close and subtracts it when it closes below. Because the line compounds direction and participation into one series, a fresh price extreme is ordinarily expected to come with a fresh OBV extreme. When price makes a higher high while OBV makes a lower high, the advance attracted less cumulative volume support: bearish divergence. A lower price low against a higher OBV low is the bullish mirror, read as selling pressure failing to expand.
The idea traces to Joseph Granville, who popularized OBV in 1963 and argued that changes in volume tend to precede changes in price. Divergence is that thesis in visual form: distribution showing up beneath a rising tape, accumulation beneath a falling one. Two honest caveats apply. OBV's all-or-nothing signing means a huge-volume bar that closes marginally lower counts as fully negative, so one outsized bar can distort the line. And divergences can persist through several further price extremes before mattering, so standard practice is to treat them as a warning that is only traded once price structure confirms.
Grading separates the tradeable divergences from the wallpaper. Swing selection comes first: comparisons drawn on confirmed pivots mean something, while disagreements involving a still-forming high evaporate retroactively. Magnitude and repetition rank next, a deep OBV shortfall across three successive price extremes outranking a shallow miss across two. And composition auditing guards against the construction's known distortion: when a divergence traces to one outsized bar, a news print or index rebalance booked entirely one way by the close-to-close rule, checking that bar's actual composition, with delta where available, decides whether the line is testifying or malfunctioning.
The workflow around the signal is settled convention: divergence warns, structure confirms, entries follow the confirmation. Detector tools automate the pivot-matched comparisons and alerting; ribbon builds run OBV beside its intrabar-weighted cousins so single-line distortions stand out; and the breakout-vetting application inverts the read, an advance into new highs on diverging OBV being the classic candidate false move. Across all of it the feed caveat stands: divergences computed on tick-count volume proxies inherit the proxy's looseness, and deserve proportionate skepticism.
How to identify OBV Divergence
OBV divergence is a swing-to-swing comparison, identified the same way as oscillator divergence.
- 1Plot OBV beneath price; its absolute value is meaningless, so only the line's swings and slope matter.
- 2Mark two successive swing highs on price in an advance, or two successive swing lows in a decline.
- 3Compare OBV at those same swing points: a price higher high with an OBV lower high is bearish divergence, and a price lower low with an OBV higher low is bullish.
- 4Require price confirmation, such as a reversal bar or a break of a swing point, before trading it, and apply extra caution when the feed reports tick volume rather than actual traded volume.
- 5Prefer multi-point divergences on confirmed pivots: a shortfall repeated across three extremes is evidence, while a single-swing disagreement on an unconfirmed high is usually noise.
How it's calculated
Compares the direction of price swings with the direction of On Balance Volume swings to flag moves that volume does not confirm.
OBV's absolute level depends on the seed and history length, so only its swings are compared, never its level.
Hidden divergences flip the price leg: a higher low in price with a lower low in OBV is hidden bullish, a lower high in price with a higher high in OBV is hidden bearish.
Pivot detection confirms k bars after the swing, so signals appear with delay and flagged divergences vary with the pivot settings.
How traders use it
- As a reversal warning at swing extremes: bearish OBV divergence into resistance, or bullish divergence into support, flags a move to distrust, with entries taken on price confirmation rather than on the divergence itself.
- As a trend-confirmation filter: while OBV keeps printing new extremes alongside price, the trend is treated as supported and continuation setups get the benefit of the doubt.
- To vet breakouts: OBV pushing to new highs ahead of or alongside a price breakout suggests accumulation behind the move, while a breakout on diverging OBV is a candidate false breakout.
- Cross-checked against other volume-based measures such as the Accumulation/Distribution Line or Money Flow Index, since each treats volume differently and agreement across them is the stronger read.
- Automated: pivot-matched detector scripts flag qualifying divergences and fire alerts, moving the labor from staring at panes to auditing the flagged candidates for swing quality and bar composition.
OBV Divergence vs related concepts
OBV: OBV is the indicator, a cumulative volume line. OBV divergence is one specific pattern read on it against price swings; the line has other uses, such as trend confirmation and breakout vetting, beyond divergence.
Volume Divergence: Raw volume divergence compares price with unsigned volume magnitudes. OBV divergence compares price with a line that already encodes close direction, so it blends the two and can fire when raw volume looks unremarkable.
Regular Bullish/bearish Divergence: The swing logic is identical to oscillator divergence, but OBV is unbounded and cumulative, with no overbought or oversold zone, so divergence is essentially the only swing signal the line produces.
Concept family
Volume & Order Flow
88 concepts mapped · 88 in the Library
OBV Divergence FAQ
Turn OBV Divergence into a trading strategy.
Take the implementation from this page into Quant, then build on it, backtest it on real data, and keep refining it in conversation.