Oscillator of Oscillator
 By LuxAlgoApr 7, 2026
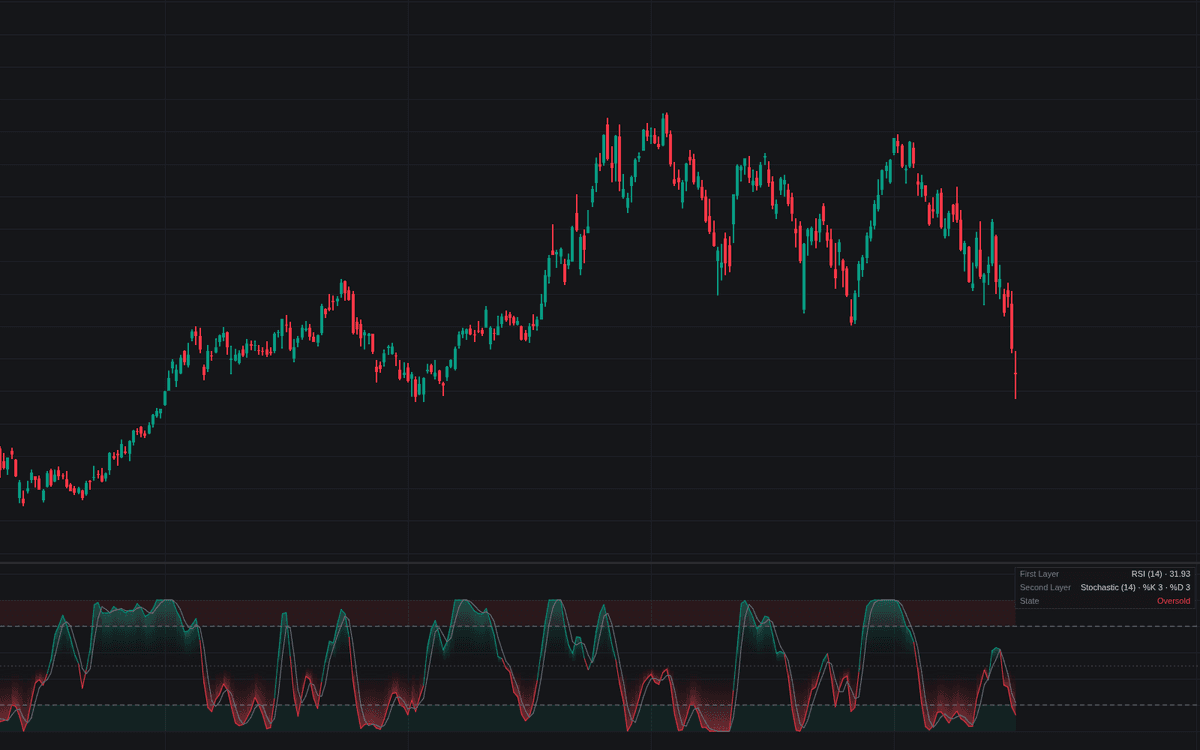

Oscillator of Oscillator is the general form of the oscillator of oscillator construction: a stochastic second layer applied to another oscillator instead of price. The first layer (RSI by default, or Stochastic %K, CCI, MFI, or Rate of Change) is optionally pre-smoothed, located inside its own recent high-low range on a 0–100 scale, then smoothed into %K and its %D signal line. %K colors by its side of the 50 midline, dashed lines mark the 80/20 extremes, and a dashboard spells out the two-pass pipeline and current state.
How to Trade the Oscillator of Oscillator?
- %K above 80: the first-layer oscillator is stretched high within its own recent range. The cross back below the level carries its own alert.
- %K below 20: the mirror stretch low; crossing back above is the recovery event.
- %K/%D crosses: the crossover trigger, alertable both ways; pane markers are off by default.
- 50 midline: the bias line: the %K color flip and the midline-cross alerts track it.
Second-layer extremes describe the oscillator, not price: a steady trend can swing the layer between extremes while price barely pauses, so anchor readings back to price structure.
Oscillator of Oscillator Settings
- Oscillator (default RSI): the first-layer base, per its standard definition.
- Length (default 14): the first-layer lookback.
- Source (default close): feeds the RSI and Rate of Change bases.
- Pre-Smoothing (default 1): SMA on the first layer; 1 means none.
- Stochastic Window (default 14): the second-layer lookback: shorter makes extremes frequent and cheap, longer behaves like the raw base.
- %K Smoothing (default 3) and %D Smoothing (default 3): output smoothing and its signal average.
- Overbought (default 80) and Oversold (default 20): the second-layer extremes.
- Show Dashboard (default enabled); Show %K/%D Cross Markers (default disabled).
Frequently Asked Questions

The Library is free. Quant makes it yours.
Pull any concept or indicator into Quant: rebuild it, retune it, or turn it into a backtested strategy of your own.