Concept
Oscillator of Oscillator
Oscillator of Oscillator is a Momentum & Oscillators concept. The Library holds 1 implementation, a working definition you can pull into Quant.
Top Oscillator of Oscillator indicator
The top custom implementation, built on the original standard Oscillator of Oscillator formula.
1 total
This Oscillator of Oscillator implementation is strategy-ready: open it in Quant, set your rules, and it backtests automatically.
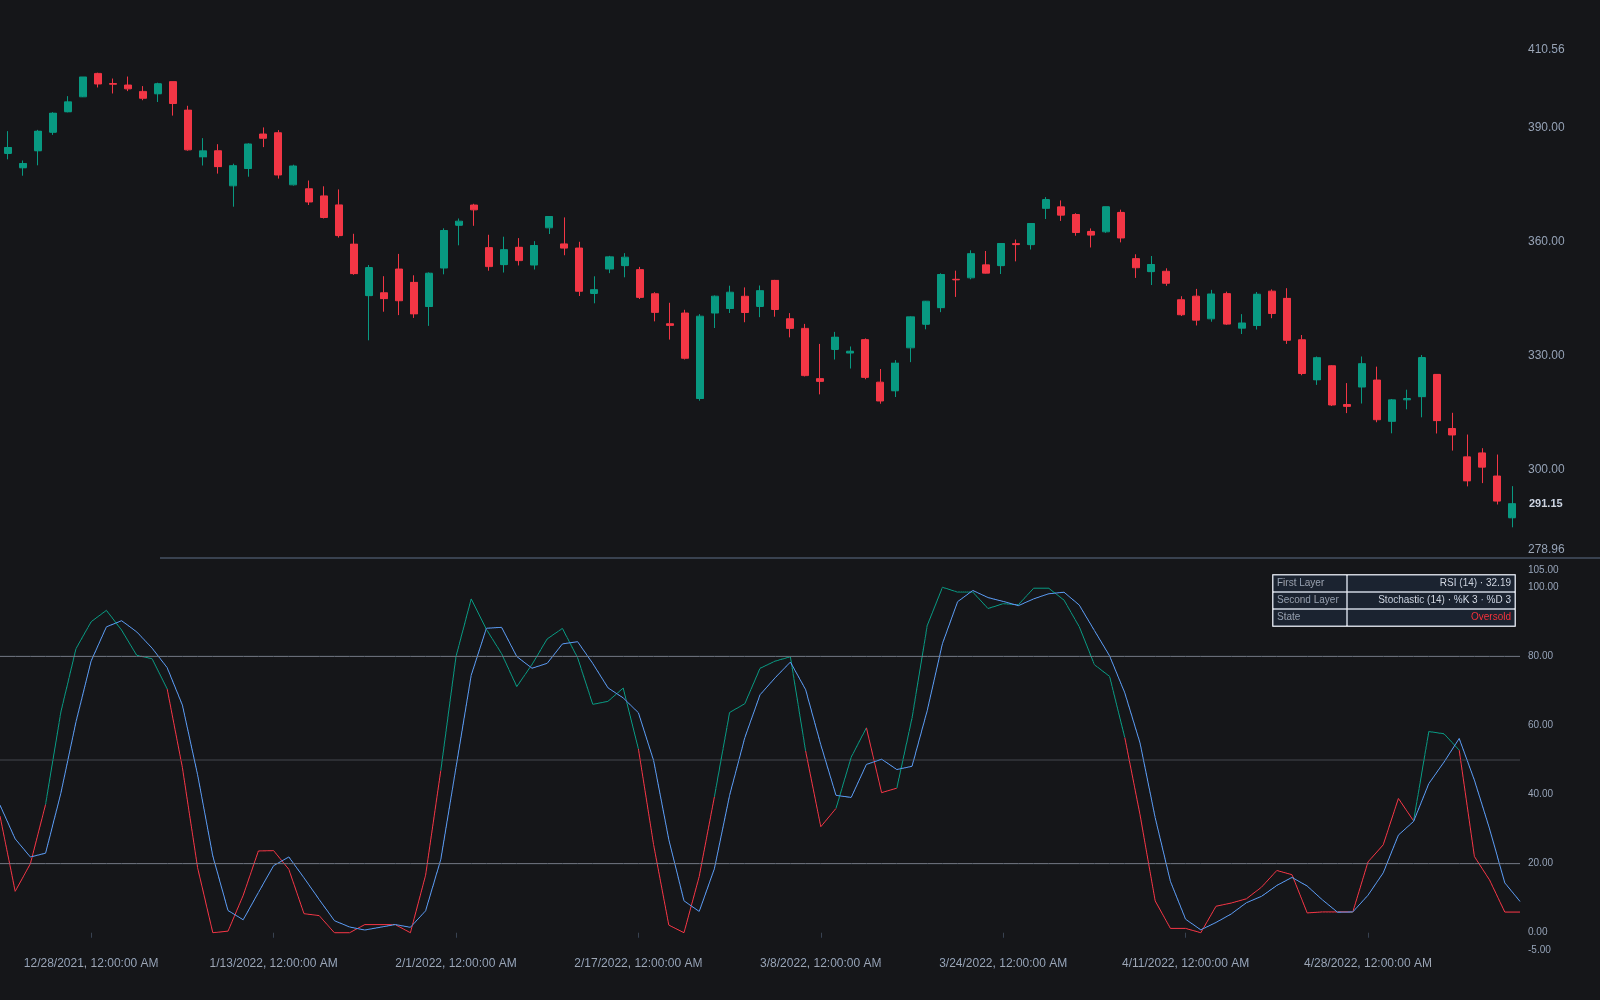
What is an Oscillator of Oscillator?
An oscillator of oscillator is a second-order indicator: an oscillator transformation applied to another oscillator's output rather than to price. Stochastic RSI is the canonical example, a stochastic calculation run on RSI values, but the pattern generalizes: an RSI of on-balance volume, a stochastic of a money-flow oscillator, a derivative of a smoothed RSI. Whatever the pairing, the second layer reads the first layer's shape, so its extremes say the underlying oscillator is stretched relative to its own recent range, not that price itself is.
The best-known member has a clear origin. Tushar Chande and Stanley Kroll introduced Stochastic RSI in their 1994 book The New Technical Trader, explicitly to fix RSI readings that flatten toward mid-range and stop reaching the classic 70/30 extremes. Their remedy, locating RSI inside its own recent high-low range using the stochastic oscillator formula, set the template that later composites follow: keep the first indicator's information, then rescale or differentiate it until its signals become readable again.
Each transformation is chosen for what it fixes: a stochastic layer rescales a sluggish input so 0-100 extremes and crossovers reappear, extra smoothing tames a jumpy one, and differencing (a derivative or ROC layer) isolates turning points in the slope. Every added layer also costs something, more lag or more noise plus another parameter set, and it moves the signal one step further from price, which is why second-order signals are usually checked against price structure before acting.
The same pattern hides inside familiar tools. The MACD histogram differences the MACD line against its own average, a transformation of an already-derived series, and the Stochastic Momentum Index applies double smoothing to a stochastic-style core. A sibling pattern is RSI of other sources, which points the RSI formula at volume or breadth data instead of price. What unites them is the reading discipline: the second layer describes the first layer's behavior, so every signal needs anchoring back to the chart.
How to identify an oscillator of oscillator
On a chart these look like any bounded oscillator; the tell is in the inputs, and construction takes two passes.
- 1Compute the first-layer oscillator as usual, for example a 14-period RSI of closing prices.
- 2Apply the second transformation to that output series: for a Stochastic RSI, record the highest and lowest RSI values over the last N bars and locate the current RSI inside that range on a 0-100 scale.
- 3Smooth the result the way the second oscillator normally is, such as %K and %D averages, since raw second-layer output is usually too jagged to read.
- 4To confirm what an unfamiliar plot is, open the indicator's settings: if the source field names another indicator rather than price, it is a second-order oscillator and its extremes describe that indicator, not price.
How it's calculated
A second-order oscillator that measures the momentum of another oscillator.
Two standard constructions exist: subtracting the oscillator's own signal average (OsMA, the MACD histogram, KaseCD) or feeding one oscillator's output into another oscillator formula (Stochastic RSI).
The spread form crosses zero exactly where the base oscillator crosses its moving average, so its peaks give earlier turn signals than the crossover itself.
Double transformation amplifies noise, so an extra smoothing step, such as a 3-bar SMA on StochRSI, is common.
How traders use it
- To restore usable extremes: running a stochastic over an oscillator that hovers mid-range brings back 0-100 readings, fixed overbought/oversold thresholds, and crossover triggers the raw series rarely produces.
- To time slope changes: a derivative or rate-of-change layer on a smoothed oscillator flags when its slope flips, earlier than waiting for a level cross.
- To normalize unbounded series such as volume oscillators or spreads into a bounded scale where alerts and consistent thresholds make sense across instruments.
- As crossover triggers: %K/%D crosses inside the second layer, or a midline cross, give discrete events that are easier to alert on than the shape of the raw oscillator.
- For divergence analysis: regular divergence and hidden divergence are marked between price swings and the second-layer plot, with the caveat that second-order divergences print more often and demand stricter confirmation.
Oscillator of Oscillator vs first-order momentum tools
Stochastic RSI: Stochastic RSI is the canonical instance of the pattern: the stochastic formula applied to RSI. The general concept covers any such stacking, including derivatives of oscillators and stochastics of money-flow series, each inheriting the same benefit of restored extremes and the same cost of one more step from price.
RSI of Other Sources: RSI of other sources changes what the first layer measures, pointing the RSI formula at volume, breadth, or another data series. An oscillator of oscillator changes how a first layer is read, wrapping it in a second transformation. A composite indicator can do both at once.
MACD: MACD is first-order: moving averages of price differenced against each other. Its histogram edges toward second-order territory by differencing the MACD line against its own average, which is why histogram turns lead the signal-line cross the same way second-layer signals lead first-layer ones.
Concept family
Momentum & Oscillators
91 concepts mapped · 91 in the Library
Oscillator of Oscillator FAQ
Turn Oscillator of Oscillator into a trading strategy.
Take the implementation from this page into Quant, then build on it, backtest it on real data, and keep refining it in conversation.