OsMA
 By LuxAlgoApr 2, 2026
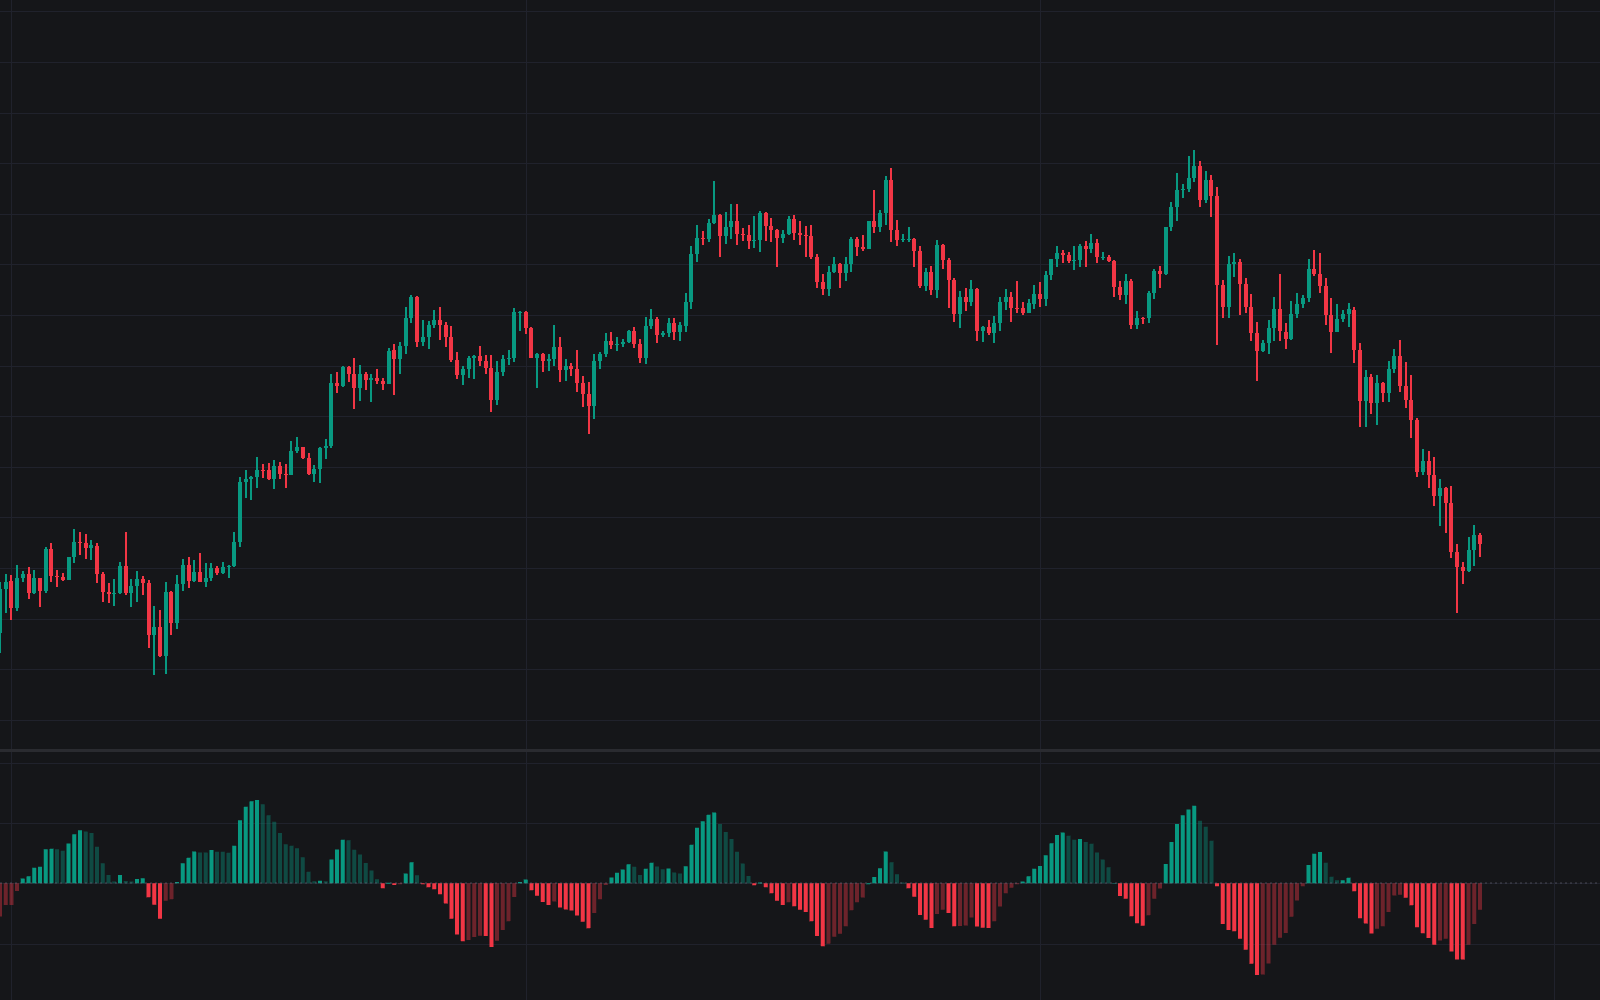

OsMA plots the classic OsMA (an oscillator's distance from its own signal average) as a four-state histogram. The oscillator is the spread between a 12-period and a 26-period EMA of the source; its 9-period EMA is the signal; and the columns show their difference around a dotted zero line, so a sign flip is exactly a signal-line crossover. Positive bars split into growing and fading tones, negative bars likewise, putting the difference between momentum building and momentum decelerating directly into the paint.
How to Trade the OsMA?
- Bullish zero cross: the histogram flips positive: the oscillator crossed above its signal line.
- Bearish zero cross: the mirror flip below zero.
- Fading bars: a bar shrinking toward zero means momentum on that side is decelerating; dedicated alerts fire on the first shrinking bar after growth on either side.
- Growing bars: momentum extending away from zero in the bar's direction: the trend side is still pressing.
Because OsMA differences an already-derived series, it turns quickly: treat a single fading bar as a caution flag rather than a standalone signal, and let the zero cross confirm the turn. All four events carry alert conditions.
OsMA Settings
- Source (default close): the price series behind both averages.
- Fast Length (default 12): the fast EMA of the underlying oscillator.
- Slow Length (default 26): the slow EMA subtracted from the fast one to form the oscillator.
- Signal Length (default 9): the EMA of the oscillator whose subtraction produces OsMA; a zero cross of the histogram is a cross of this line.
- Style inputs set the four histogram states (growing and fading on each side of zero) and the zero line color.
Frequently Asked Questions

The Library is free. Quant makes it yours.
Pull any concept or indicator into Quant: rebuild it, retune it, or turn it into a backtested strategy of your own.