Concept
OsMA
OsMA is a Momentum & Oscillators concept. The Library holds 1 implementation, a working definition you can pull into Quant.
Top OsMA indicator
The top custom implementation, built on the original standard OsMA formula.
1 total
The OsMA implementation below can become a backtested trading strategy — describe your rules and Quant writes the code.
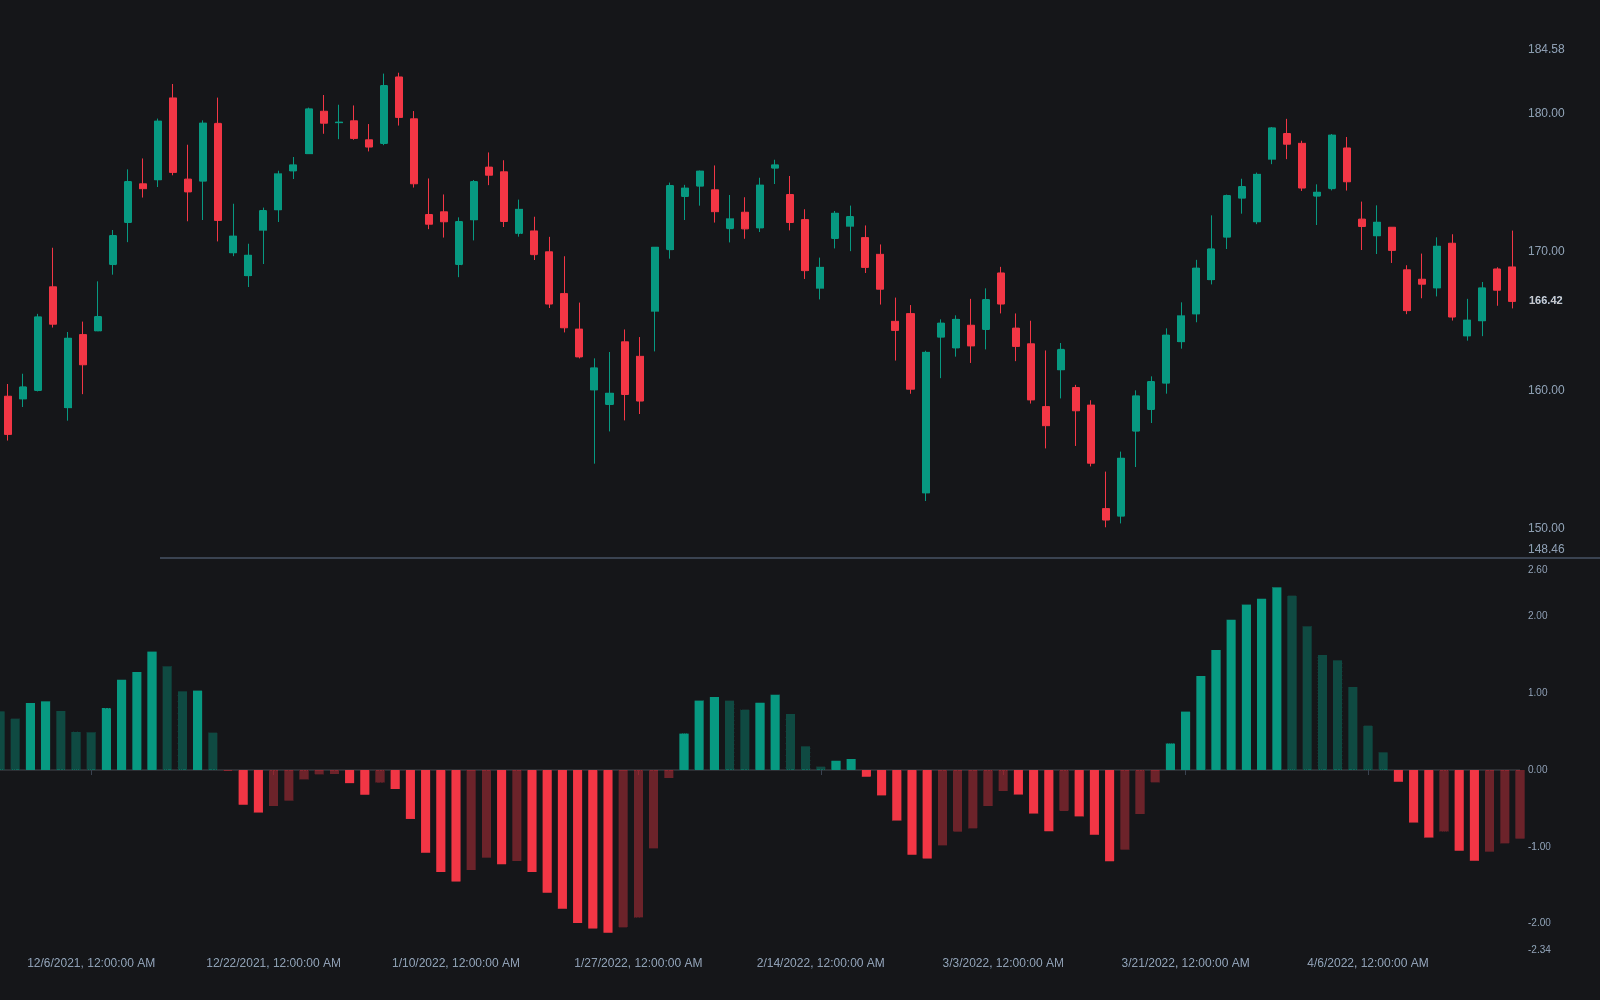
What is OsMA?
OsMA stands for Oscillator of a Moving Average (some platforms list it as Moving Average of Oscillator). It plots the difference between an oscillator and its signal line, a moving average of that same oscillator. In the standard form the oscillator is the MACD line and the signal is its 9-period average, which makes OsMA numerically identical to the MACD histogram: the same values under a different name, a convention popularized by the built-in indicator lists of retail forex platforms.
The lineage runs through MACD itself. Gerald Appel developed the MACD in the late 1970s, and Thomas Aspray added the histogram in 1986 precisely to visualize the gap between the MACD line and its signal line before a crossover completes. OsMA is that same quantity carried into the retail forex world: MetaTrader shipped it as a standard indicator under the Moving Average of Oscillator name, and the platform's enormous user base made the OsMA label common currency even though the calculation itself dates to the 1980s.
Subtracting the signal isolates how far momentum has pulled away from its own average. Growing OsMA bars mean the MACD line is pulling away from its signal, momentum building in that direction; shrinking bars mean the two are converging, which is what precedes a signal-line cross. Because it differences an already-derived series, OsMA tends to turn earlier than the MACD line itself but is also noisier, so readings usually focus on bar-to-bar direction and zero crosses rather than absolute height.
Because OsMA is unbounded, it has no fixed overbought or oversold levels: a histogram extreme on a calm chart would be an ordinary bar on a volatile one, and readings are not comparable across instruments. That separates it from bounded tools like RSI or the stochastic oscillator and explains the reading conventions: bar direction, sign flips, and divergences carry the information, while absolute bar height mostly reflects recent volatility.
How to identify OsMA on a chart
OsMA plots as a histogram in a subpanel around a zero line, and verifying what a given platform calls OsMA takes one comparison.
- 1Compute the standard MACD line: the 12-period EMA of closes minus the 26-period EMA.
- 2Compute the signal line, a 9-period EMA of that MACD line.
- 3Subtract the signal from the MACD line and plot the result as bars around zero; positive bars mean the MACD line is above its signal, negative bars mean below.
- 4Check it against the MACD histogram on the same chart: with default settings the two plots should be numerically identical, and any difference means the platform generalizes OsMA to another oscillator or uses non-standard smoothing.
- 5Read the shape: growing bars are momentum pulling away from its average, shrinking bars are convergence, and a sign flip is the signal-line crossover itself.
How traders use it
- As a crossover trigger: OsMA crossing zero is exactly a MACD signal-line cross expressed as a sign flip, so systems often use the bars turning positive or negative as the entry or exit event.
- As an early deceleration warning: bars that shrink while price keeps extending show momentum fading before any cross prints, a cue to tighten stops or skip late entries.
- As a divergence source: comparing OsMA peaks and troughs against price swing highs and lows is a common way to mark regular divergence, since the histogram's extremes are well defined, with hidden divergence read the same way in continuation contexts.
- As a trend-side filter: some traders take entries only in the direction of OsMA's sign, treating positive bars as permission for longs and negative bars for shorts, combined with structure so range-bound flips are filtered out.
- For exit timing: a shrinking histogram into a target zone argues for taking profit or tightening the stop before the crossover confirms, using the deceleration itself as the actionable event.
OsMA vs other momentum readings
MACD: MACD is the parent plot: two lines whose crossover is the classic signal. OsMA collapses that relationship into one histogram showing the distance between the lines, so it surfaces the same events earlier in shape, through shrinking bars, but contains no information the two lines do not.
ROC: ROC measures price change over a fixed lookback, one step from price and expressed in percent, so readings compare across instruments. OsMA is a difference of derived averages in price units, so its scale depends on the instrument and its volatility, while its turns tend to be smoother.
Momentum: The momentum indicator is the rawest reading, the close minus the close N bars back: fast and noisy. OsMA sits toward the other end of the same spectrum, where multiple smoothing layers make turns cleaner but slower to register a sudden shift.
Concept family
Momentum & Oscillators
91 concepts mapped · 91 in the Library
OsMA FAQ
Turn OsMA into a trading strategy.
Take the implementation from this page into Quant, then build on it, backtest it on real data, and keep refining it in conversation.