Concept
Parkinson Estimator
Parkinson Estimator is a Volatility concept. The Library holds 1 implementation, a working definition you can pull into Quant.
high-low range
Top Parkinson Estimator indicator
The top custom implementation, built on the original standard Parkinson Estimator formula.
1 total
Want to trade Parkinson Estimator? The implementation below is one prompt away from a backtested strategy in Quant.
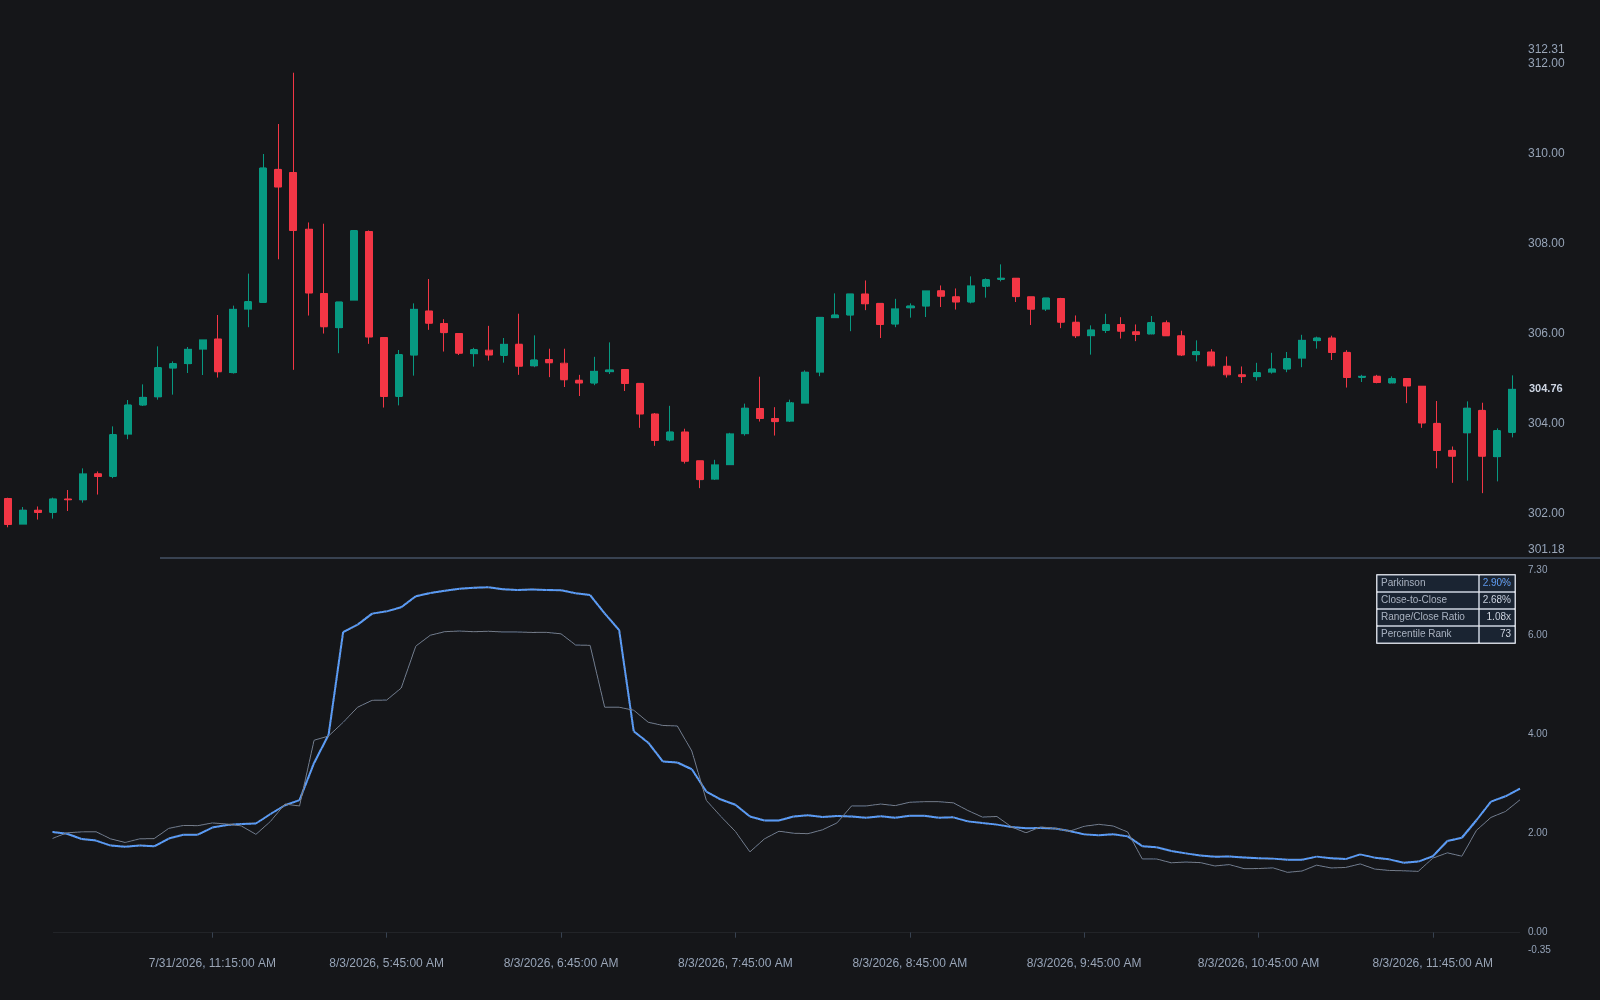
What is the Parkinson Estimator?
The Parkinson estimator computes historical volatility from the high-low range: the per-bar variance estimate is the squared natural log of high over low, divided by four times the natural log of two, then averaged over a window and annualized. Physicist Michael Parkinson published it in 1980. The intuition is that a bar's extremes sample the whole path traveled rather than one endpoint, so under idealized assumptions (zero drift, continuous trading) it is roughly five times more efficient than close-to-close historical volatility: a much shorter window achieves the same precision.
The method's roots are in physics rather than finance: Parkinson had worked on estimating a random walk's diffusion constant from its extreme values, and the 1980 Journal of Business paper carries that machinery over to prices through the known distribution of the range of Brownian motion. It opened a small lineage of range-based estimators: Garman and Klass added the open and close the same year, Rogers and Satchell (1991) built a version that tolerates drift, and Yang and Zhang (2000) combined overnight and intraday terms to handle gaps as well. The family's shared premise is that the day's high and low contain information about the path that a close-only series throws away.
Its blind spots are its inputs. Overnight gaps never appear inside a bar's span, so gap-prone assets are understated; there is no mean adjustment, so strong drift widens ranges and bleeds trend into the estimate; and discretely traded highs and lows sit inside the true continuous extremes, a mild downward bias in thin markets. The Garman-Klass estimator adds open/close information, and the Yang-Zhang estimator handles gaps and drift together.
On a chart the estimator lives in the same tool space as more familiar range measures. ATR also reads bar ranges but includes gaps through the true-range definition and outputs a price distance rather than an annualized volatility; realized volatility built from intraday returns is the higher-resolution alternative when tick or minute data exists. Parkinson's niche is extracting a statistically respectable volatility number from nothing but OHLC bars, which is why it appears inside volatility bands, position-sizing rules, and regime studies where a fast, low-lag estimate matters more than a perfect one.
How to compute and read Parkinson volatility
The estimator is a few lines on any platform with OHLC data:
- 1For each bar, take the natural log of high divided by low, square it, and divide by 4 ln 2 (about 2.773); that is the bar's variance estimate.
- 2Average the per-bar values over the chosen window, take the square root, and annualize by multiplying by the square root of bars per year (roughly the square root of 252 for daily bars).
- 3Plot it in a sub-pane beside close-to-close volatility over the same window; the level says how volatile, the gap between the two says where movement happens.
- 4Read persistent divergences as structure: Parkinson below close-to-close points to overnight gaps doing the moving, Parkinson above it points to wide intraday travel the closes keep hiding.
- 5Rank the current reading against its own history with a volatility percentile so band widths and sizing respond to regime rather than raw level.
How it's calculated
An estimate of return volatility built from each bar's high-to-low range instead of close-to-close changes.
Parkinson (1980) derived it for a driftless geometric Brownian motion with continuous trading.
It ignores overnight gaps and drift, so it understates volatility on gapping or strongly trending markets.
Roughly 5 times more statistically efficient than the close-to-close estimator; Garman-Klass, Rogers-Satchell and Yang-Zhang refine it with open and close data.
How traders use it
- As a fast-settling volatility input for bands, stop distances, and sizing when the lookback must stay short: the range is informative enough that modest windows give usable readings.
- As a gap diagnostic next to close-to-close volatility: Parkinson well below it says movement arrives between sessions; well above it says sessions are churny and wide-ranged even when closes land quietly.
- As one leg of estimator composites: OHLC volatility studies often report Parkinson beside Garman-Klass and Rogers-Satchell so the spreads between them can be inspected.
- As band raw material: range-based volatility can set channel width where close-based standard deviation lags, an alternative footing to Bollinger Bands or the ATR distance inside Keltner Channels; high/low historical volatility bands are built this way.
- As a compression gauge: because it stabilizes on short windows, it flags range expansion or contraction promptly, complementing squeeze tools such as the TTM Squeeze that infer the same shift from band geometry.
Parkinson Estimator vs other volatility measures
ATR: Both read bar ranges, but ATR's true range spans gaps from the prior close and outputs an average price distance for stops and targets. Parkinson excludes gaps, works in log space, and estimates annualized volatility; one is a trading distance, the other a statistic.
Realized Volatility: Realized volatility sums squared intraday returns and sharpens as sampling gets finer, at the cost of needing intraday data. Parkinson approximates much of that path information from just the high and low, the practical choice when only OHLC bars exist.
Bollinger Bands: Bollinger Bands measure the standard deviation of price around a moving average, a close-based dispersion in price units. Feeding a band study with Parkinson volatility instead changes what the width responds to: intraday travel rather than closing scatter.
Concept family
Volatility
57 concepts mapped · 57 in the Library
Parkinson Estimator FAQ
Turn Parkinson Estimator into a trading strategy.
Take the implementation from this page into Quant, then build on it, backtest it on real data, and keep refining it in conversation.