Concept
%B
%B, also known as percent B, Bollinger %B, is a Volatility concept. The Library holds 1 implementation, a working definition you can pull into Quant.
Top %B indicator
The top custom implementation, built on the original standard %B formula.
1 total
Want to trade %B? The implementation below is one prompt away from a backtested strategy in Quant.
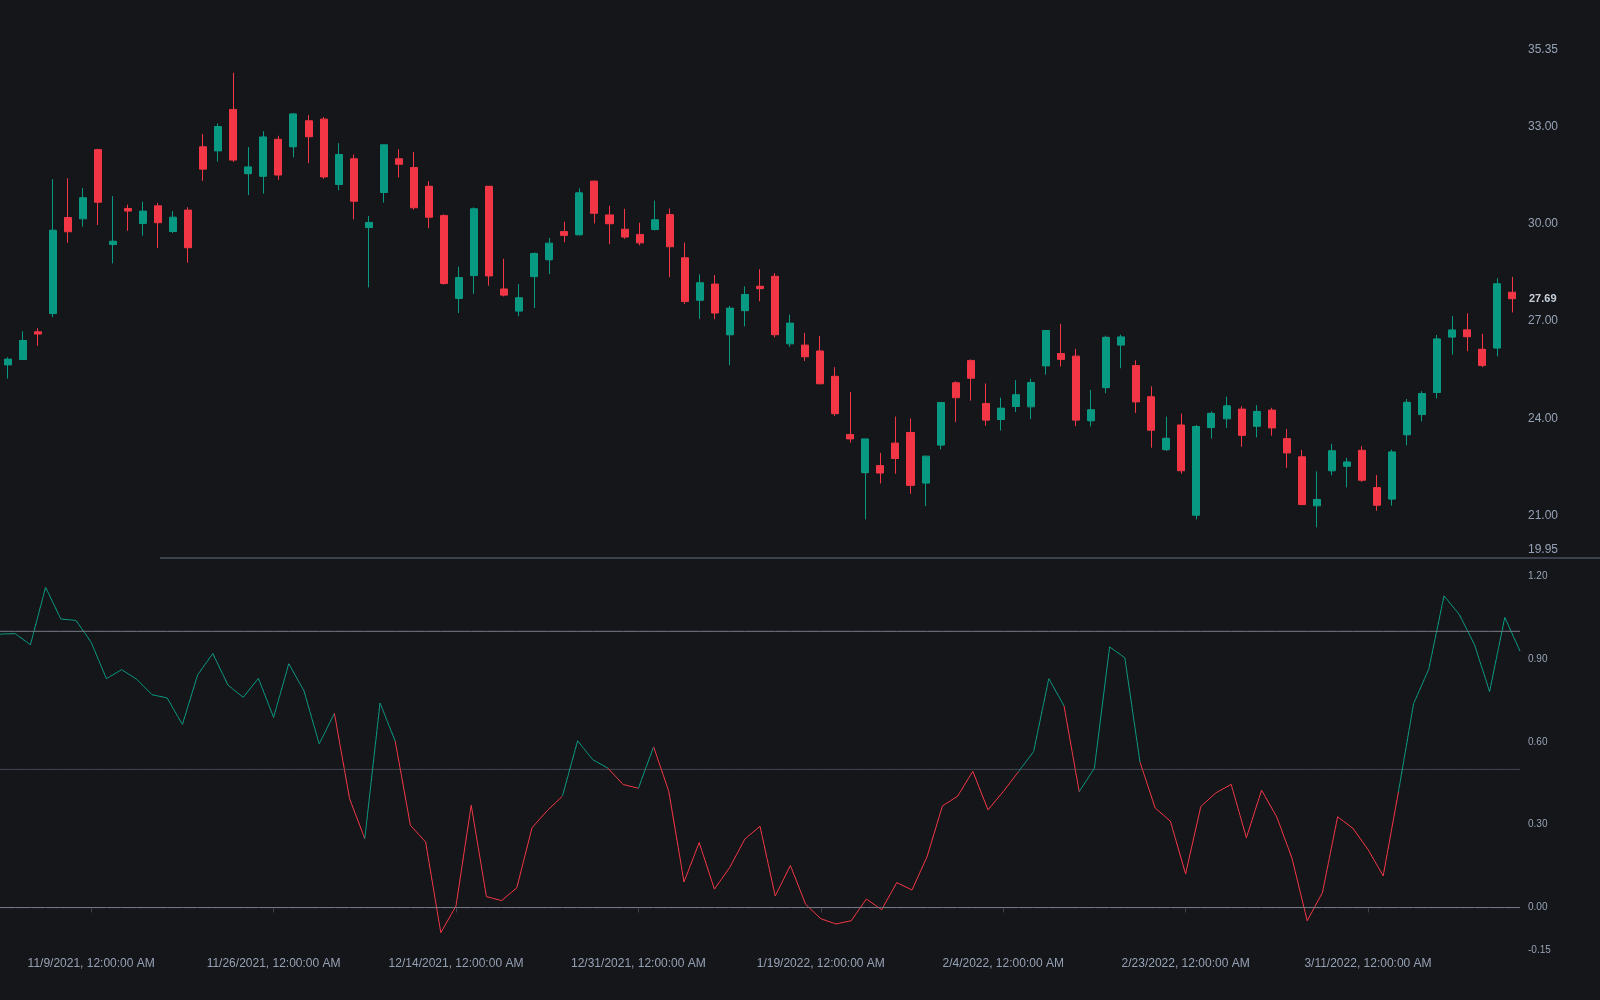
What is %B?
%B is John Bollinger's companion statistic to his bands: it expresses where price sits within Bollinger Bands as a single number, computed as (price - lower band) divided by (upper band - lower band). A value of 1 puts price exactly at the upper band, 0 at the lower band, and 0.5 at the middle band; readings above 1 or below 0 mean price is outside the bands, which the formula permits because %B is not hard-bounded. With standard two-standard-deviation bands, %B amounts to a shifted and scaled version of the z-score of price against its lookback mean: the z-score divided by four, plus one half.
The point of %B is normalization. Raw price at the upper band means different things on different charts, but %B = 1 means the same thing everywhere: price sits exactly at the upper band for the settings in use. That makes band position comparable across symbols and timeframes, chartable as an oscillator, and usable as an input to screens and systems. Interpretation stays regime-dependent, though: in a range, extreme %B suggests stretch; in a trend, price can walk the band and hold %B near 1 for many bars, where high readings mark strength rather than an imminent reversal.
How to calculate %B
%B is derived entirely from Bollinger Bands, so the band settings determine everything downstream.
- 1Compute Bollinger Bands with your chosen settings; the default is a 20-period simple moving average with bands at plus and minus 2 standard deviations.
- 2Apply the formula: %B = (price - lower band) ÷ (upper band - lower band), typically using the close.
- 3Read the scale: 1 means price is at the upper band, 0.5 at the middle band, 0 at the lower band; above 1 or below 0 means price is outside the bands.
- 4Plot it as an oscillator beneath the chart, which makes band position, its trend, and its divergences easier to see than on the price panel.
How traders use it
- As a normalized overbought/oversold gauge in ranging markets: %B near its extremes flags band tags that mean-reversion approaches fade, with the standing caveat that trends can pin %B at an extreme for long stretches.
- For Bollinger's W-bottom and M-top patterns: a second price low that undercuts the first while %B holds a higher low shows the retest happened closer to or inside the bands, a volatility-adjusted form of divergence.
- As trend confirmation: sustained high readings (price walking the upper band) indicate persistent strength, so some systems require %B to stay above a threshold to remain long rather than treating extremes as fades.
- As a machine-readable input: because %B compresses price-versus-bands into one roughly unit-scaled number, it slots cleanly into screeners, scoring systems, and model features.
%B vs related concepts
BandWidth: Bollinger's other derived statistic: BandWidth measures how wide the bands are (volatility), while %B measures where price sits within them (position). The two are complements, not substitutes.
Stochastic Oscillator: Also a position-within-a-range measure, but the range is the lookback's highest high to lowest low, so it is hard-bounded between 0 and 100. %B locates price within statistical bands and can exceed its nominal bounds.
Z-score: With default bands, %B is an affine rescaling of the z-score of price. The z-score speaks in standard deviations directly; %B speaks in band-relative units traders already watch on the chart.
Concept family
Volatility
57 concepts mapped · 57 in the Library
%B FAQ
Turn %B into a trading strategy.
Take the implementation from this page into Quant, then build on it, backtest it on real data, and keep refining it in conversation.