POC Sweep Reclaim
![]() By LuxAlgoFeb 18, 2026
By LuxAlgoFeb 18, 2026
The POC Sweep Reclaim (PSR) model is a price action trading indicator designed to detect high-probability liquidity traps around the Point of Control (POC). By combining lower timeframe (LTF) volume aggregation with a two-step “sweep then reclaim” confirmation, this trading strategy highlights moments where price first rejects a high-volume level and then decisively reclaims it—often signaling a shift in short-term market control.
Unlike standard support and resistance tools, the PSR trading indicator focuses on market microstructure behavior: rejection of value followed by acceptance beyond it. This makes it especially useful for traders seeking structured entries after liquidity grabs, stop-loss cascades, and failed breakouts.
How to Trade the POC Sweep Reclaim Trading Indicator
The POC Sweep Reclaim model visualizes a two-event sequence:
- The Sweep (Rejection of Value)
- The Reclaim (Acceptance Beyond Value)
Together, these form a complete trading setup centered around the previous candle’s Point of Control (POC)—the price level with the highest traded volume.
The Sweep (The Rejection Phase)
A Sweep occurs when price probes beyond the previous bar’s POC with a wick, but the candle body fails to close past it. This behavior signals a failed breakout attempt and often traps traders who entered on the initial push.
This is commonly known as a liquidity grab.
-
Buyside Sweep (Bearish Rejection):
Price wicks above the previous POC but closes back below it.
This suggests buyers attempted to push higher but failed to achieve acceptance. -
Sellside Sweep (Bullish Rejection):
Price wicks below the previous POC but closes back above it.
This suggests sellers attempted to break lower but failed to gain control.
At this stage, the market has rejected the move—but the trade is not yet confirmed. The sweep alone identifies trapped participants, not direction.
The Reclaim (The Acceptance Phase)
The true signal in this trading strategy occurs on the very next candle.
A Reclaim happens when price closes decisively beyond the same POC level that was just rejected. This shows that the side that initially failed has now regained control and achieved acceptance beyond value.
-
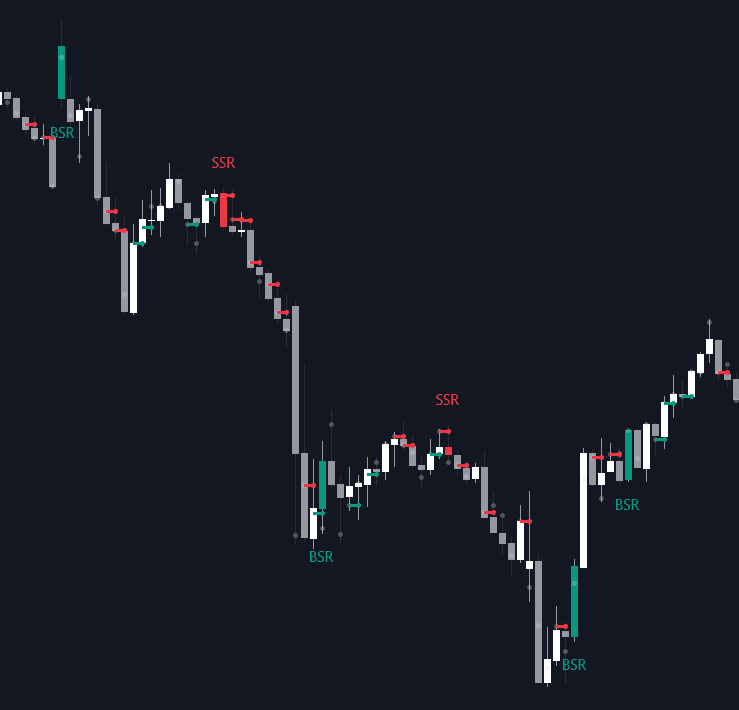
BSR (Buyside Reclaim):
After a Buyside Sweep, price closes above the swept upper POC.
This bullish signal suggests that trapped breakout sellers may fuel upside continuation. -
SSR (Sellside Reclaim):
After a Sellside Sweep, price closes below the swept lower POC.
This bearish signal suggests downside follow-through after clearing liquidity.
This two-step pattern—rejection followed by acceptance—forms the core of the PSR trading model and can be used for:
- Breakout continuation strategies
- Intraday reversal trading
- Liquidity-based scalping setups
- Market structure confirmation entries
Why the POC Matters in This Trading Strategy
The Point of Control (POC) represents the highest-volume traded price within a candle. In market profile theory, high-volume nodes act as:
- Psychological value areas
- Liquidity clusters
- Mechanical support and resistance levels
When price interacts with the POC, it is interacting with consensus value. A failure beyond it indicates rejection. A successful close beyond it indicates acceptance and potential dominance by one side.
This makes the POC Sweep Reclaim model particularly effective for traders focused on:
- Order-flow concepts
- Volume-based trading strategies
- Liquidity trap identification
- Market microstructure analysis
Academic Intuition Behind the PSR Model
Order-Flow Imbalance (OFI)
Short-term price movements are often driven by temporary imbalances in liquidity. A sweep reflects a moment where one side attempts to push price but lacks sufficient depth. A reclaim signals that the opposing side has absorbed liquidity and taken control.
Salient Price Levels
Research shows that high-volume nodes attract liquidity. These “salient” prices become battlegrounds between buyers and sellers. The POC frequently acts as a decision point in intraday trading.
Stop-Loss Cascades
Sweeps often trigger clusters of stop-loss orders. When price reclaims the swept level, it can create momentum as the market clears liquidity and accelerates away from trapped traders.
Practical Considerations for Traders
Footprint Proxy
This trading indicator approximates volume-at-price using lower timeframe aggregation (such as 1-minute data). While not as precise as a true footprint engine, it provides a practical and accessible proxy for most traders.
Data Snooping Risk
Like all pattern-based trading strategies, the PSR model should be validated using robust backtesting and forward testing. Not every sweep-reclaim sequence will result in a sustained move.
Repainting Considerations
Because the POC is derived from lower timeframe data, the value for the current developing candle may fluctuate until the bar closes. Confirm signals only after candle completion.
Indicator Settings Explained
-
Lower Timeframe for POC:
Controls the granularity of volume aggregation. Lower timeframes (e.g., 1-minute) provide a more precise POC estimate. -
Show POC:
Displays calculated POC dots for each candle. -
Show Sweep Dots:
Marks wick interactions where rejection occurs without a body close beyond the POC. -
Show BSR (Buyside Reclaim):
Highlights confirmed bullish reclaim signals. -
Show SSR (Sellside Reclaim):
Highlights confirmed bearish reclaim signals.
When to Use the POC Sweep Reclaim Model
This trading indicator performs particularly well in:
- High-liquidity markets (indices, forex majors, crypto majors)
- Intraday timeframes (1m–1h)
- Trending markets after pullbacks
- Breakout environments with visible liquidity clusters
For best results, combine the PSR trading strategy with:
- Higher timeframe bias
- Session highs and lows
- Fair Value Gaps (FVGs)
- Market structure analysis
- Risk management rules based on invalidation at the swept POC
FAQ
What is the POC Sweep Reclaim trading indicator?
It is a volume-based trading indicator that identifies liquidity traps around the Point of Control and confirms direction using a two-step sweep and reclaim pattern.
Is the PSR model suitable for beginners?
Yes. While based on advanced market microstructure concepts, the visual signals are straightforward: first a sweep (rejection), then a reclaim (acceptance). Beginners can use it alongside basic trend analysis.
Does this trading strategy repaint?
The current bar’s POC may fluctuate while forming due to lower timeframe aggregation. However, confirmed sweep and reclaim signals should be evaluated only after candle close.
How do I access the POC Sweep Reclaim indicator?
You can get access on the LuxAlgo Library for charting platforms like TradingView, MetaTrader (MT4/MT5), and NinjaTrader for free.
Free indicator
Get free access to this indicator on the platforms below.
Unlock the entire LuxAlgo Library
Every indicator, every strategy, full charts, and complete access to Quant — our AI agent.