Polynomial Regression Band
 By LuxAlgoJun 24, 2026
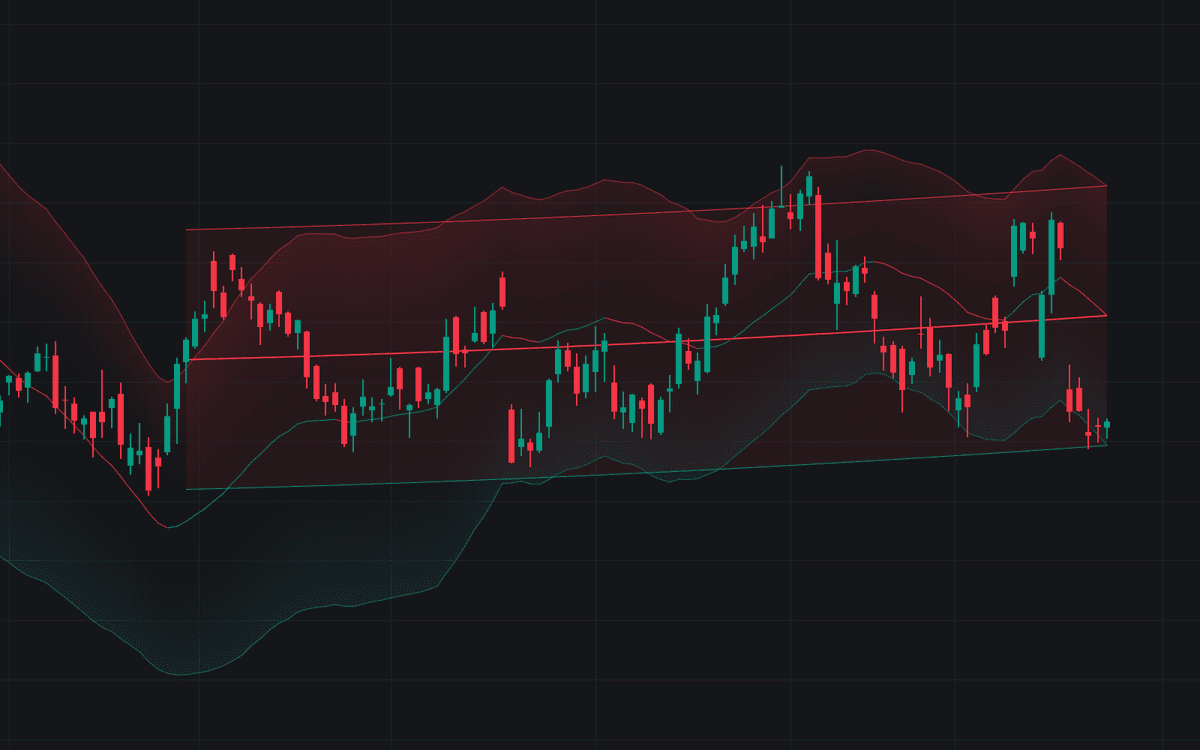

Polynomial Regression Band fits a degree-2 polynomial to the last 100 bars by least squares and offsets the fit by a multiple of its residual standard deviation, for a channel that curves with the trend rather than averaging it into a straight line. This definitive clean build of the polynomial regression band separates the tool's two versions: a causal end-point line keeping only the newest fitted value per bar (never redrawing, the series every alert measures against) and the current window's full curve, which openly re-fits on every bar.
How to Trade the Polynomial Regression Band?
- Slope turns: the end-point line flipping direction is the trend read; both turns fire alerts.
- Band pullbacks: a wick into the lower band while the fit rises (or the upper while it falls) is the pullback watched as curved dynamic support or resistance.
- Band closes and re-entries: a close beyond a band marks stretch (a context read, since strong trends can ride a band) and the close back inside frames mean reversion toward the fit.
Only the end-point series suits rule testing: a live alert matches its plotted history. The curve is context, deliberately not extended past the last bar: extrapolation is unreliable.
Polynomial Regression Band Settings
- Source (default close): series the polynomial is fitted to.
- Length (default 100): the rolling fit window. Shorter hugs recent swings, longer smooths them.
- Degree (default 2): the fit's polynomial degree.
- Band Multiplier (default 2): half-width of the channel in residual standard deviations.
- End-Point Band (default enabled): the causal line and its bands.
- Fitted Curve (Repaints) (default enabled): the current window's curved channel.
- Gradient Fill (default enabled): shading from the fit to each band; remaining Style inputs set colors.
Frequently Asked Questions

The Library is free. Quant makes it yours.
Pull any concept or indicator into Quant: rebuild it, retune it, or turn it into a backtested strategy of your own.