Concept
Polynomial Regression Band
Polynomial Regression Band, also known as end-point polynomial regression, is a Trend concept. The Library holds 1 implementation, a working definition you can pull into Quant.
Top Polynomial Regression Band indicator
The top custom implementation, built on the original standard Polynomial Regression Band formula.
1 total
The Polynomial Regression Band implementation below can become a backtested trading strategy — describe your rules and Quant writes the code.
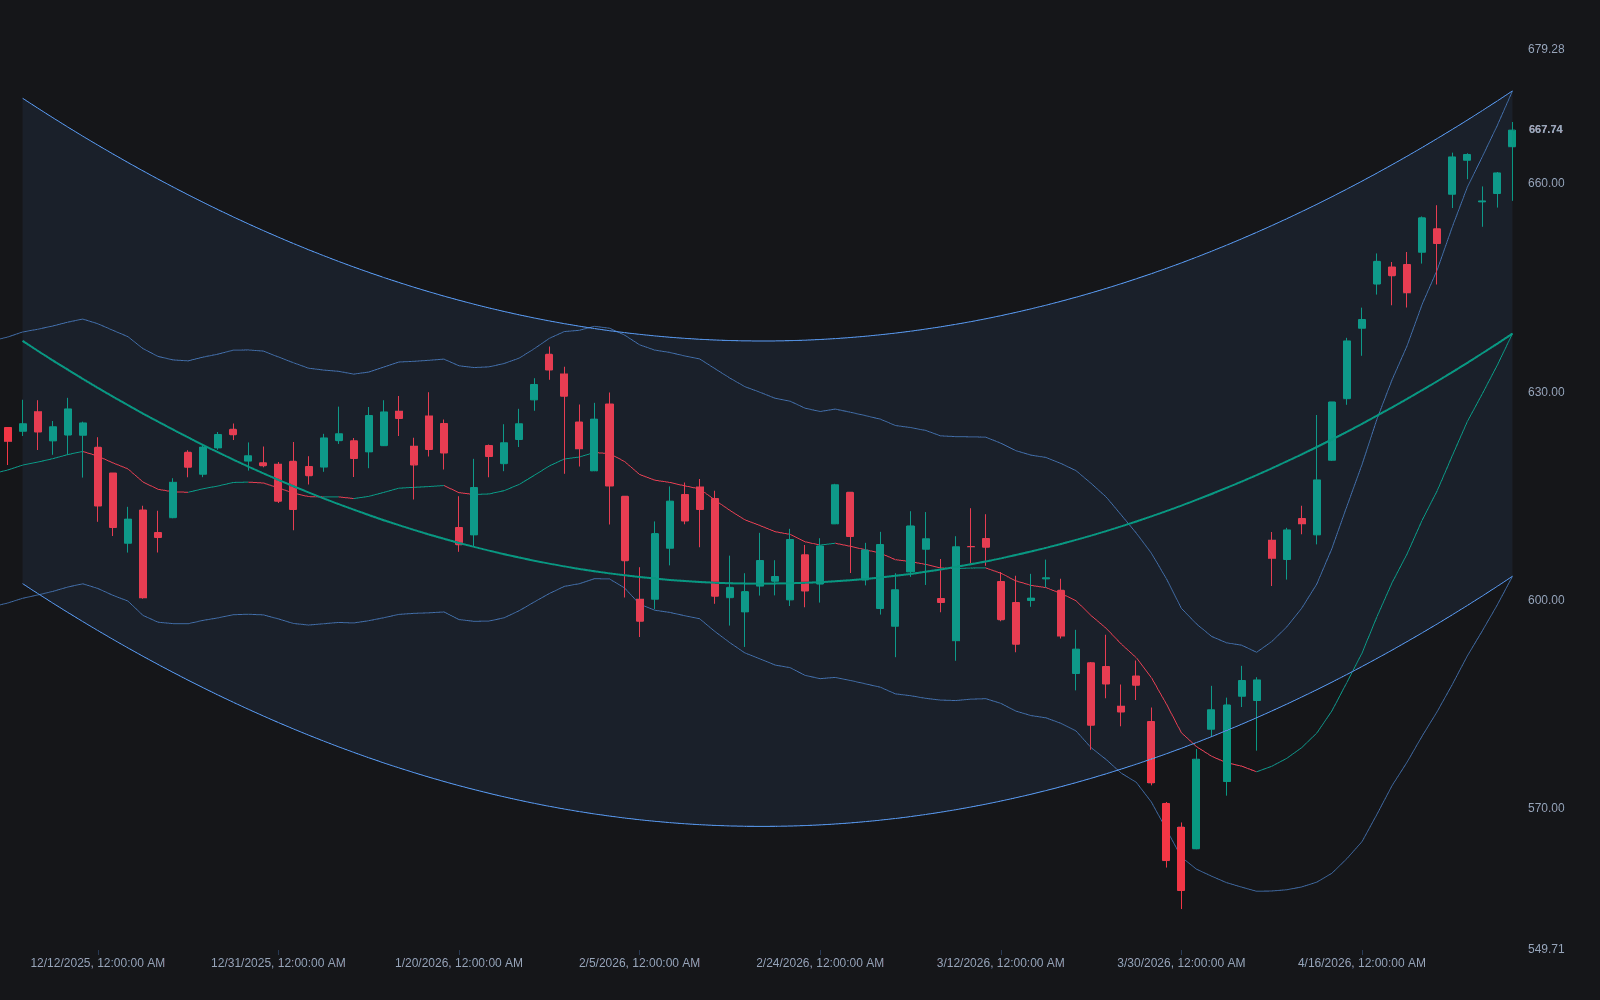
What is a Polynomial Regression Band?
A polynomial regression band is a curved channel built by fitting a polynomial to recent prices with least squares, then offsetting the fitted curve above and below by a volatility measure, usually a multiple of the fit's standard deviation or root-mean-square error. Where a linear-regression channel forces a straight line through the window, a polynomial of degree two or higher can bend with the data, so the channel follows curved trends and rounded turns more closely.
Two versions exist. The full-curve version draws the fitted polynomial across the whole lookback and refits on every new bar, so the historical segment moves as data arrives. The end-point version keeps only the newest fitted value per bar, producing a causal line that never redraws (the same idea behind the LSMA, which is the end point of a linear fit). Higher degrees track price more tightly but fit noise and behave erratically near the window's edges, so extrapolating the curve forward is unreliable.
The construction has a famous commercial ancestor: the Belkhayate Center of Gravity, Mostapha Belkhayate's polynomial-band system from the MetaTrader era, which drew a fitted curve with layered rails and traded reversion from the outer bands back toward the center. Library builds in that lineage, like the Belkhayate-styled iceberg study, keep the layered-rail presentation. Offsets themselves come in flavors: fixed multiples of the residual deviation give symmetric rails, while quantile-fitted offsets let the bands honor asymmetric residuals, wider where the fit systematically misses on one side.
Deployment splits cleanly by version. The end-point line is the tradeable object: causal, honest, its slope a curvature-sensitive direction filter in the slope-filter spirit, its crossings a smoother-turning alternative to average crossovers. The full-curve band is the analytical object: a hindsight-smoothed description of the window for studying where price sat relative to its fitted path. Mixing the two, backtesting touch rules on the refitted curve, manufactures the classic repaint illusion, which is the single most important thing to know about the tool.
How to identify a polynomial regression band
A fit, an offset, and a version choice: the third decision matters most.
- 1Choose the window and degree, two or three covering most chart uses before noise-fitting begins.
- 2Fit the polynomial by least squares across the window's closes.
- 3Offset the rails: multiples of the residual standard deviation or RMSE for symmetric bands, quantile fits for asymmetric ones.
- 4Choose the version deliberately: full-curve for display and research, end-point for anything that feeds signals or tests.
- 5Read touches by regime: outer-rail tags fade-worthy in rotation, riding rails normal in trends, with the end-point slope as the regime hint.
How it's calculated
A least squares polynomial fit of price over a lookback window, with bands offset from the fit by a multiple of the residual deviation.
The whole in-window fit is recomputed as the window slides, so drawn history repaints; the end-point variant never revises past points.
Some versions offset the bands by the maximum absolute residual or an ATR multiple instead of sigma.
High degrees fit noise and swing hard near the window edges, so k above 4 is rarely used.
How traders use it
- As curved dynamic support and resistance: pullbacks toward the lower band in a rising fit, or the upper band in a falling one, are watched for reactions, with band width scaling to how loosely price sits around the curve.
- As a mean-reversion frame inside the window: price stretched to an outer band is treated as extended relative to the fitted curve, a context read rather than a standalone signal, since strong trends can ride a band for many bars.
- As a smoother trend proxy: the slope of the end-point line gives a direction filter that picks up curvature sooner than a straight regression line, at the cost of more noise sensitivity as the degree rises.
- In Belkhayate-style reversion systems: entries staged at the outer rails targeting the center curve, gated by a regime check so trend days, when rails ride rather than reject, are excluded.
- As crossover material: price or a fast average crossing the end-point line gives turn signals that bend with the market, a curved alternative to straight moving average crossovers with the same confirmation trade-offs.
Polynomial bands vs related channels
Linear Regression Channel: The straight-line special case: one slope across the window, rails parallel to it. The polynomial version buys curvature, following arcing trends the line misrepresents, and pays with extra parameters, noise sensitivity, and livelier edge behavior.
MA Envelope: The envelope offsets a moving average, a causal smoother with lag; the band offsets a least-squares fit, lag-free inside the window but refit-revised. Same rail grammar, different centerlines, and the difference is exactly lag versus hindsight.
LSMA: The LSMA is the end-point idea at degree one: the newest value of a rolling linear fit, plotted causally. The polynomial end-point line generalizes it to curved fits, and the band adds the volatility casing around either.
Concept family
Trend
100 concepts mapped · 100 in the Library
Polynomial Regression Band FAQ
Turn Polynomial Regression Band into a trading strategy.
Take the implementation from this page into Quant, then build on it, backtest it on real data, and keep refining it in conversation.