


Price Simplification
Feb 14, 2026
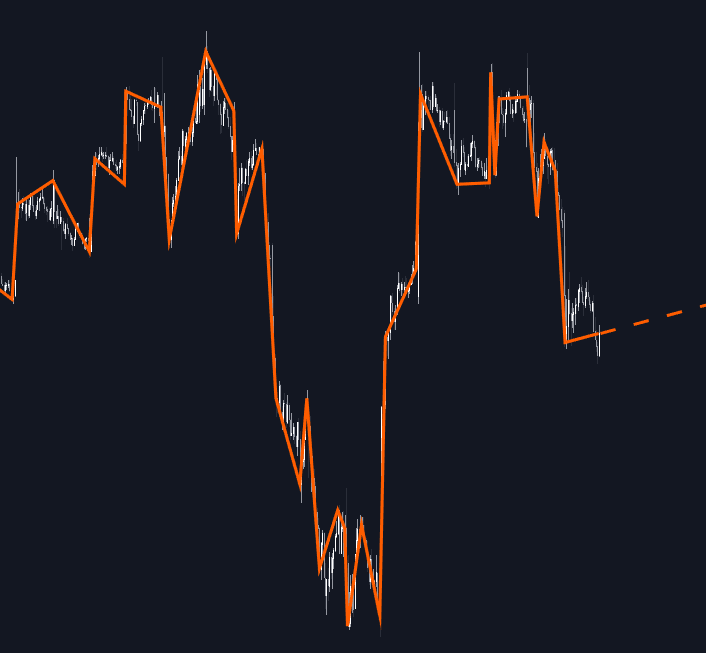
The Price Simplification indicator is a powerful trading indicator that transforms complex price action into clean, easy-to-read trend segments using the Ramer-Douglas-Peucker (RDP) algorithm. By filtering out insignificant fluctuations and focusing only on structurally meaningful pivots, this tool helps traders clearly visualize market geometry, key turning points, and dominant trend direction across any asset or timeframe.
This indicator calculates its output based on a fixed window of historical data. Consequently, the line segments are displayed retrospectively and are subject to repainting as new bars develop and the calculation window shifts.
How to Trade the Price Simplification Indicator
The core objective of this trading strategy tool is to eliminate noise and reveal the true structure of the market. Instead of reacting to every candle or minor pullback, traders can focus on the major swing points that define support, resistance, and trend slope.
By simplifying price into a connected series of structural segments, the indicator allows you to:
- Identify the dominant trend direction at a glance
- Detect structural higher highs and lower lows
- Visualize breakout zones and consolidation geometry
- Clarify support and resistance levels
- Improve trade timing by aligning with major swing structure
This makes the Price Simplification indicator ideal for swing traders, trend-followers, and even scalpers who want a clearer framework for decision-making.
Adjusting Sensitivity for Different Trading Styles
The simplification level is volatility-adjusted, giving traders flexibility across markets such as forex, crypto, indices, and stocks.
- A lower ATR Multiplier produces a more responsive line that captures smaller price swings. This is ideal for short-term trading strategies.
- A higher ATR Multiplier aggressively filters noise and highlights only the most significant market turns. This works well for position trading and macro trend analysis.
By adapting sensitivity, traders can tailor the indicator to match their risk tolerance and trading timeframe.
Using the Extension Line for Momentum Bias
The “Extend Last Segment” feature enhances the indicator’s practical trading value.
When enabled, the tool projects the slope of the final simplified segment forward using a dashed line. This projection begins one bar after the most recent data point and serves as a visual momentum guide.
Traders can use this forward extension to:
- Gauge whether current price aligns with prevailing momentum
- Anticipate potential continuation scenarios
- Identify slope shifts that may precede reversals
While not a predictive model, this visual extension acts as a structural momentum compass.
How the RDP Algorithm Enhances This Trading Indicator
The Price Simplification indicator is built on the Ramer-Douglas-Peucker (RDP) algorithm, widely used in computer graphics and cartography to simplify complex curves without losing essential structure.
Applied to financial time series, the algorithm:
- Connects the first and last price points within a defined window
- Measures the maximum perpendicular distance of intermediate points
- Retains only structurally significant deviations
- Removes insignificant fluctuations
If no point exceeds the threshold distance, the entire structure is represented by a single straight line. If a point exceeds the threshold, the segment splits and the process repeats recursively.
This mathematical framework creates a volatility-aware structural map of price movement.
Volatility Normalization with ATR
To ensure consistency across markets and timeframes, the indicator normalizes price coordinates using the Average True Range (ATR).
This means:
- The simplification threshold adapts dynamically to volatility
- The indicator remains effective on both low-volatility and high-volatility assets
- Structural sensitivity remains stable across intraday and higher timeframes
Rather than relying on fixed price distances, the ATR-adjusted threshold ensures the simplified structure reflects true market conditions.
Indicator Settings Explained
Understanding the settings allows traders to integrate this tool into their broader trading strategy effectively.
- Window Size: Defines how many recent bars are analyzed. Larger windows capture broader structure; smaller windows focus on near-term price action.
- ATR Multiplier: Controls simplification sensitivity. Higher values = fewer segments and stronger filtering.
- ATR Length: Determines how volatility is measured for normalization.
- Line Color: Customizes the simplified structural line.
- Line Width: Adjusts visibility and emphasis.
- Extend Last Segment: Projects the slope of the final segment forward as a dashed line starting one bar after the last structural point.
Why Traders Use Price Simplification in Their Trading Strategy
Traditional chart analysis often becomes cluttered with noise, indicators, and micro-swings that distort decision-making. This trading indicator strips price down to its structural essence.
It can be combined with:
- Market structure break strategies
- Order block analysis
- Trend-following systems
- Breakout trading setups
- Volatility-based strategies
Because it focuses purely on geometric price structure, it integrates seamlessly into both discretionary and algorithmic trading systems.
FAQ
Does the Price Simplification indicator repaint?
Yes. Because the calculation is performed on a rolling historical window, the simplified segments are displayed retrospectively and may adjust as new bars form.
Is this indicator suitable for all markets?
Yes. Thanks to ATR normalization, it adapts well to stocks, crypto, forex, commodities, and indices across multiple timeframes.
How do I access the Price Simplification indicator?
You can get access on the LuxAlgo Library for charting platforms like TradingView, MetaTrader (MT4/MT5), and NinjaTrader for free.
Trading & investing are risky and many will lose money in connection with trading and investing activities. All content on this site is not intended to, and should not be, construed as financial advice. Decisions to buy, sell, hold or trade in securities, commodities and other investments involve risk and are best made based on the advice of qualified financial professionals. Past performance does not guarantee future results.
Hypothetical or Simulated performance results have certain limitations. Unlike an actual performance record, simulated results do not represent actual trading. Also, since the trades have not been executed, the results may have under-or-over compensated for the impact, if any, of certain market factors, including, but not limited to, lack of liquidity. Simulated trading programs in general are designed with the benefit of hindsight, and are based on historical information. No representation is being made that any account will or is likely to achieve profit or losses similar to those shown.
Testimonials appearing on this website may not be representative of other clients or customers and is not a guarantee of future performance or success.
As a provider of technical analysis tools and strategies, we do not have access to the personal trading accounts or brokerage statements of our customers. As a result, we have no reason to believe our customers perform better or worse than traders as a whole based on any content, tool, or platform feature we provide.
Charts used on this site are by TradingView in which the majority of our technical indicators are built on. TradingView® is a registered trademark of TradingView, Inc. www.TradingView.comTradingView® has no affiliation with the owner, developer, or provider of the Services described herein.
Market data is provided by CBOE, CME Group, BarChart, CoinAPI. CBOE BZX real-time US equities data is licensed from CBOE and provided through BarChart. Real-time futures data is licensed from CME Group and provided through BarChart. Select cryptocurrency data, including major coins, is provided through CoinAPI. All data is provided “as is” and should be verified independently for trading purposes.
This does not represent our full Disclaimer. Please read our full disclaimer.
© 2026 LuxAlgo Global, LLC.