Price Zone Oscillator
 By LuxAlgoJul 23, 2026
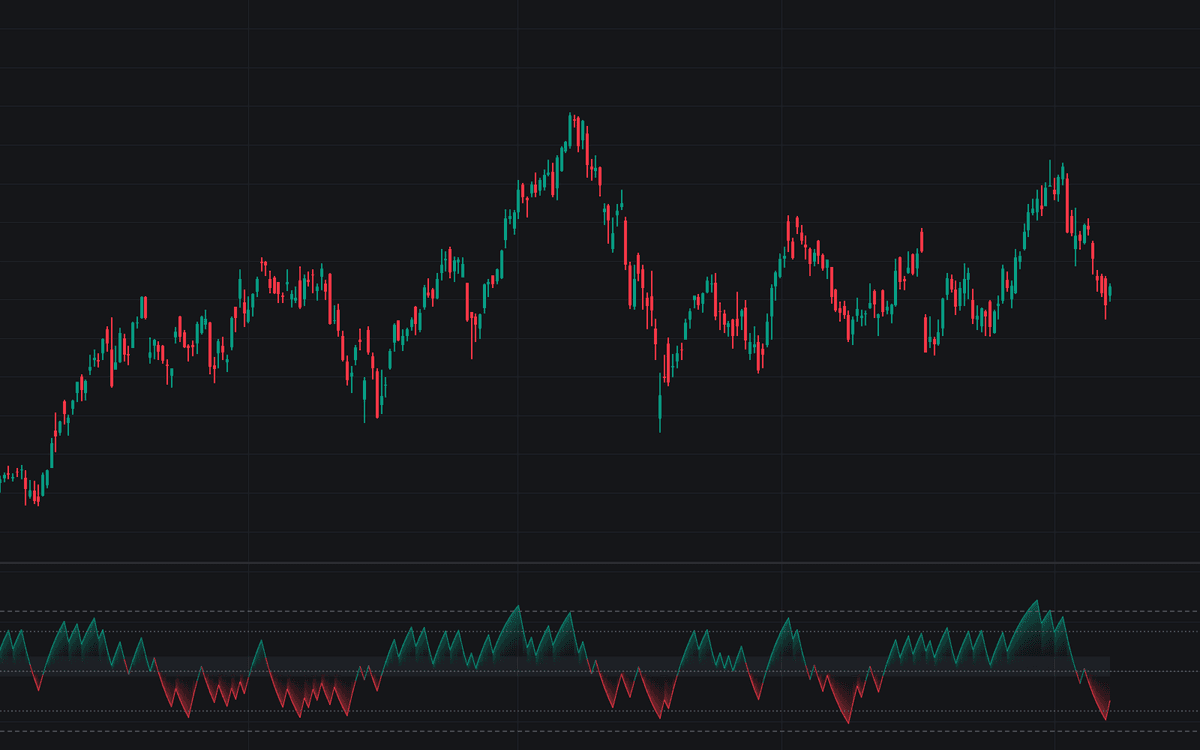

Price Zone Oscillator votes every bar up or down (a close above the prior close keeps its value, anything else counts negative), then smooths the signed series with an EMA and divides by an EMA of the raw closes. The resulting percentage is the Price Zone Oscillator: a gauge of how consistently closes have been rising or falling, where a string of small up closes weighs as heavily as a few large ones. The line colors by sign over a gradient fill, with the authors' zone map drawn as dashed extremes, dotted thresholds and a shaded neutral band.
How to Trade the Price Zone Oscillator?
- Cross above the Bullish Threshold (+40): closes have turned persistently positive, the level the authors tied to significant upside pressure, with a matching alert (mirrored at -40).
- Overbought (+60) / Oversold (-60): stretched territory, faded mainly in ranges; the Fade alerts fire when the line turns back inside, the more usable event, since trends can pin extremes for long stretches.
- Neutral band (+15 to -5): readings here carry little standalone meaning (the authors read them through a separate trend filter), and the zero-cross alerts mark the sign change.
Price Zone Oscillator Settings
- Length (default 14): period of both EMAs; shorter trips the zones more often, longer suits position trading but delays crossings.
- Source (default close): the series that is signed and smoothed.
- Overbought Level (default 60) and Oversold Level (default -60): the stretch extremes.
- Bullish Threshold (default 40) and Bearish Threshold (default -40): the directional-pressure levels.
- Neutral Zone Upper (default 15) and Neutral Zone Lower (default -5): bounds of the shaded low-information band.
- Gradient Fill and Neutral Zone Fill (both on), plus color controls.
Frequently Asked Questions

Original indicatorBuilt in-house by LuxAlgo
The Library is free. Quant makes it yours.
Pull any concept or indicator into Quant: rebuild it, retune it, or turn it into a backtested strategy of your own.