Volume Zone Oscillator
 By LuxAlgoMay 21, 2026
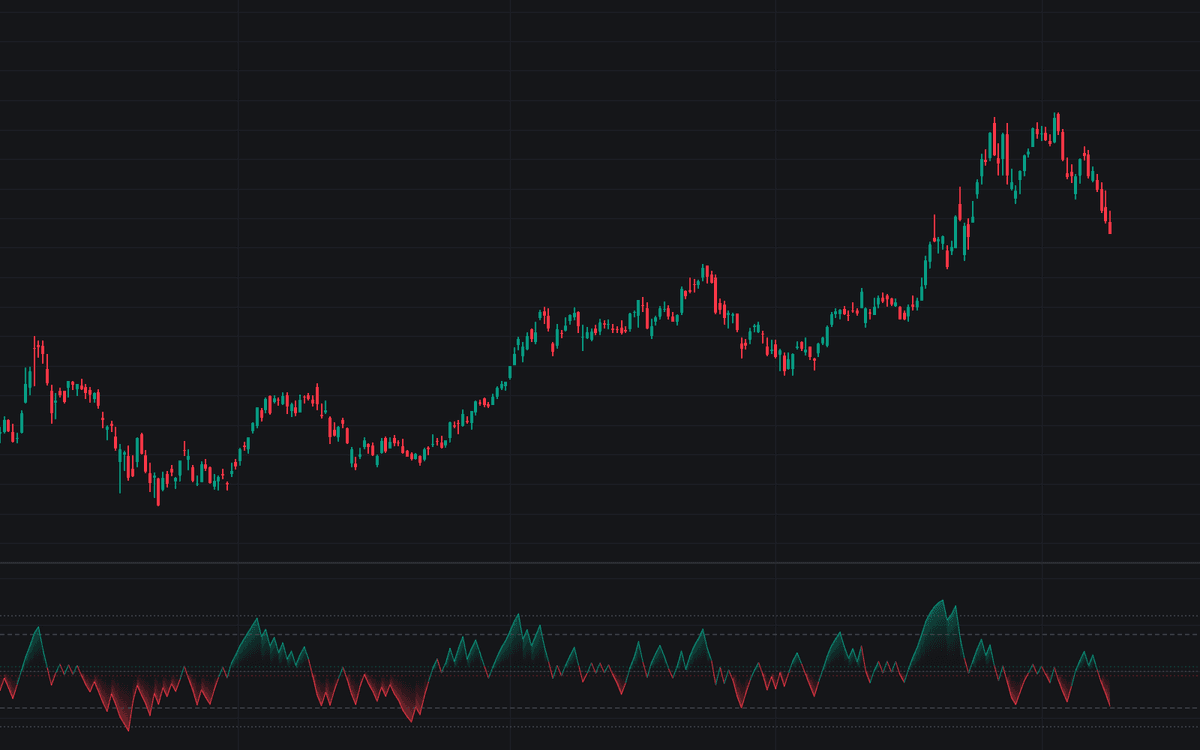

Volume Zone Oscillator is the definitive clean build of Khalil and Steckler's bounded volume gauge. Per the Volume Zone Oscillator construction, each bar's full volume is credited to buyers on up closes and sellers on down closes, and a 14-period EMA of that signed series is divided by a 14-period EMA of total volume, times 100, bounding the reading between -100 and +100. The line prints bullish above zero and bearish below with a gradient fill, against the complete published level framework: regime boundaries at ±5, overbought/oversold at ±40, extremes at ±60.
How to Trade the Volume Zone Oscillator?
- VZO holding above the Bullish Regime level (+5): turnover concentrating on up closes, a buyer-controlled tape.
- VZO holding below the Bearish Regime level (-5): sellers control the volume flow; between the two is neutral churn.
- Visits beyond ±40: stretched volume pressure that tends to fade in ranging markets. The fade back through the level has its own alerts.
- Readings beyond ±60: volume flow this one-sided is rarely sustained and often precedes exhaustion of the move that produced it.
Eight alert conditions cover regime starts, overbought/oversold entries, the fades back out, and both extremes.
Volume Zone Oscillator Settings
- Length (default 14): EMA length for both signed and total volume; longer favors the regime-filter read, shorter makes overbought/oversold visits more frequent.
- Bullish Regime (default 5) and Bearish Regime (default -5): the boundaries around zero separating controlled tape from churn.
- Overbought (default 40) and Oversold (default -40): the stretch levels, most meaningful in ranges.
- Extreme Overbought (default 60) and Extreme Oversold (default -60): the exhaustion watch levels.
- Style inputs set the colors of the oscillator, regime lines, level lines, and zero line.
Frequently Asked Questions

The Library is free. Quant makes it yours.
Pull any concept or indicator into Quant: rebuild it, retune it, or turn it into a backtested strategy of your own.