


Renko Boxes
Feb 17, 2026
The Renko Boxes indicator is a powerful volatility-adaptive trading indicator that overlays dynamic Renko bricks directly onto your standard candlestick chart. By using the Average True Range (ATR) to calculate brick size, this trading strategy tool automatically adjusts to changing market conditions—helping traders filter out noise, clarify trend direction, and identify high-probability reversal points without switching to a separate Renko chart.
How to Trade with the Renko Boxes Indicator?
Unlike traditional Renko charts that operate independently of time, this indicator integrates Renko logic directly into your main price chart. That means you can analyze standard candles, wicks, and price structure while simultaneously viewing volatility-based Renko levels.
This hybrid approach makes the Renko Boxes indicator ideal for:
- Trend-following trading strategies
- Breakout confirmation setups
- Volatility-based market analysis
- Reversal detection systems
When price moves beyond a defined ATR-based threshold, a new Renko box forms. These boxes represent meaningful price movement rather than minor fluctuations, helping traders stay focused on directional momentum instead of market noise.
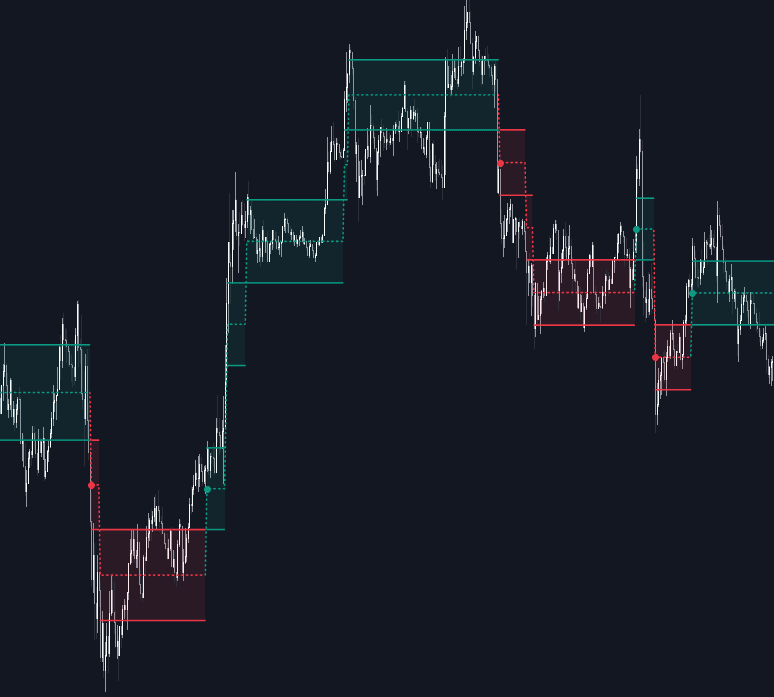
Trend Interpretation for Smarter Trade Decisions
Understanding trend direction is essential for any trading strategy. The Renko Boxes indicator simplifies this process visually and systematically.
-
Bullish Trend:
Displayed as green boxes with a green dotted average line. This structure forms when price consistently closes above the upper threshold of the previous brick, signaling upward momentum. -
Bearish Trend:
Displayed as red boxes with a red dotted average line. This occurs when price consistently breaks below the lower threshold of the previous brick, confirming downward pressure.
Because brick size is based on ATR, trend signals adapt automatically to volatility. During high-volatility periods, bricks expand to prevent over-sensitivity. In low-volatility conditions, bricks contract to remain responsive.
This dynamic behavior makes the indicator highly effective across multiple asset classes including stocks, forex, crypto, and futures markets.
Using Renko for Entry and Exit Timing
Traders commonly use Renko overlays for:
- Entering long positions during confirmed bullish brick sequences
- Entering short positions during confirmed bearish sequences
- Waiting for reversal dots to confirm a trend shift
- Using the dotted average line as a trailing reference
A reversal occurs only when price moves in the opposite direction by more than one full brick size. This requirement reduces false signals and improves signal quality for structured trading strategies.
If price gaps or makes a strong impulse move, the script automatically calculates how many bricks were crossed and updates the Renko levels accordingly. This ensures price integrity and keeps the structure aligned with real market movement.
Visual Components That Enhance Market Clarity
The Renko Boxes indicator includes several visual tools designed to improve decision-making and reduce cognitive load:
-
Renko Boxes:
Shaded brick regions representing active price brackets. These are constructed using the__BLOCK_0__property to ensure clean transitions without graphical overlap. -
Reversal Dots:
Circular markers that appear precisely when the Renko trend flips from bullish to bearish or vice versa. These act as high-visibility confirmation signals. -
Average Line:
A dotted line tracking the median price of the current Renko level. This acts as a smoothed trend guide and can be used as a trailing bias reference.
These elements combine to create a structured trading environment that supports both discretionary and systematic trading approaches.
Indicator Logic and Volatility Adaptation
The core mechanism behind this trading indicator is the ATR-based brick size calculation.
Instead of using a fixed box size, the Renko Boxes indicator calculates brick size from the Average True Range. This provides several advantages:
- Automatic volatility adaptation
- Improved trend filtering
- Reduced whipsaw signals
- Greater consistency across timeframes
Because volatility fluctuates throughout market cycles, fixed Renko bricks can either become too sensitive or too slow. By tying brick size to ATR, this indicator maintains balance between responsiveness and noise reduction.
Renko Settings and Customization
The Renko Boxes indicator includes flexible settings to match different trading styles and risk profiles.
Renko Configuration
-
ATR Length:
Defines the lookback period used to calculate the Average True Range. Shorter values increase responsiveness. Longer values create smoother, more stable brick structures. -
ATR Multiplier:
Controls brick sensitivity.- Higher multiplier → Larger bricks → Stronger noise filtering
- Lower multiplier → Smaller bricks → Faster signal generation
Scalpers may prefer smaller multipliers for tighter structure, while swing traders often benefit from larger bricks to capture macro trends.
Visual Customization
-
Bullish Color:
Defines the color of upward Renko boxes and average lines. -
Bearish Color:
Defines the color of downward Renko boxes and average lines.
This ensures the indicator integrates cleanly with any chart theme or trading workspace.
Why Use an Overlay-Based Renko Trading Indicator?
Traditional Renko charts require switching to a separate chart type, which removes candlestick detail and time-based context. The Renko Boxes indicator solves this limitation by combining:
- Time-based candlestick analysis
- Volatility-adjusted Renko structure
- Clear trend visualization
- Reversal confirmation markers
This makes it a versatile tool for both standalone use and integration into larger trading systems that include momentum indicators, moving averages, or volume analysis.
FAQ
What makes this different from traditional Renko charts?
Traditional Renko charts are time-independent and displayed separately. This indicator overlays Renko bricks directly onto your existing candlestick chart, allowing you to combine price action and Renko analysis in one view.
Is this trading indicator suitable for all markets?
Yes. Because brick size is based on ATR, the indicator automatically adapts to volatility across stocks, forex, crypto, indices, and futures markets.
How do I access the Renko Boxes indicator?
You can get access on the LuxAlgo Library for charting platforms like TradingView, MetaTrader (MT4/MT5), and NinjaTrader for free.
Trading & investing are risky and many will lose money in connection with trading and investing activities. All content on this site is not intended to, and should not be, construed as financial advice. Decisions to buy, sell, hold or trade in securities, commodities and other investments involve risk and are best made based on the advice of qualified financial professionals. Past performance does not guarantee future results.
Hypothetical or Simulated performance results have certain limitations. Unlike an actual performance record, simulated results do not represent actual trading. Also, since the trades have not been executed, the results may have under-or-over compensated for the impact, if any, of certain market factors, including, but not limited to, lack of liquidity. Simulated trading programs in general are designed with the benefit of hindsight, and are based on historical information. No representation is being made that any account will or is likely to achieve profit or losses similar to those shown.
Testimonials appearing on this website may not be representative of other clients or customers and is not a guarantee of future performance or success.
As a provider of technical analysis tools and strategies, we do not have access to the personal trading accounts or brokerage statements of our customers. As a result, we have no reason to believe our customers perform better or worse than traders as a whole based on any content, tool, or platform feature we provide.
Charts used on this site are by TradingView in which the majority of our technical indicators are built on. TradingView® is a registered trademark of TradingView, Inc. www.TradingView.com TradingView® has no affiliation with the owner, developer, or provider of the Services described herein.
Market data is provided by CBOE, CME Group, BarChart, Massive, CoinAPI. Select U.S. equities data is provided through Massive. CBOE BZX real-time U.S. equities data is licensed from CBOE and provided through BarChart. Real-time futures data is licensed from CME Group and provided through BarChart. Select cryptocurrency data, including major coins, is provided through CoinAPI. All data is provided “as is” and should be verified independently for trading purposes.
This does not represent our full Disclaimer. Please read our full disclaimer.
© 2026 LuxAlgo Global, LLC.