Rogers-Satchell Estimator
 By LuxAlgoMay 21, 2026
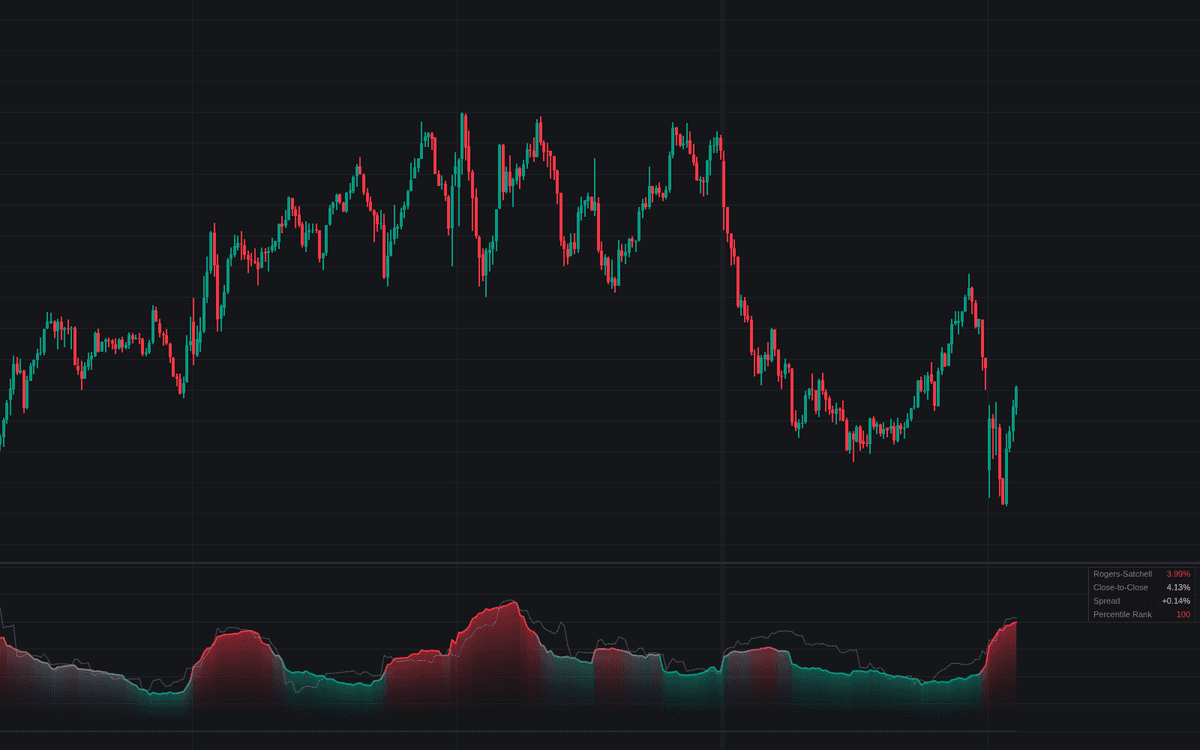

Rogers-Satchell Estimator plots drift-independent realized volatility: each bar contributes ln(H/C)·ln(H/O) + ln(L/C)·ln(L/O), a term that prices two-sided movement inside the bar; a candle running open-to-close in a straight line scores zero. The clean build of the Rogers-Satchell estimator averages the term over a 20-bar window, annualizes at 252 bars per year, and adds workflow: a close-to-close drift diagnostic, percentile-ranked alerts, and a dashboard.
How to Trade the Rogers-Satchell Estimator?
- Read the spread: a persistent gap between the close-to-close comparison and the Rogers-Satchell line shows how much of the reading is drift or gaps rather than two-sided movement.
- Compression: the percentile rank crossing under 20 marks quiet two-sided conditions that often precede range expansion, and because drift cancels, a market can read compressed while still grinding one way.
- Expansion: the rank crossing above 80 flags an expanded regime, a sizing input, not a directional call.
Rogers-Satchell Estimator Settings
- Window Length (default 20): bars the per-bar variance is averaged over; four log relations per bar stabilize short windows.
- Annualize (default enabled) and Bars Per Year (default 252): scaling to annualized volatility; match the constant when comparing tools.
- Close-to-Close Comparison (default enabled): the drift-sensitive baseline on identical settings.
- Percentile Lookback (default 100) with High Percentile (default 80) and Low Percentile (default 20): the rank window and alert thresholds.
- Show Percentile Levels (default disabled): dotted levels at the two thresholds.
- Show Dashboard (default enabled) with Position (default Top Right) and Size (default Small); Style inputs set colors and the Gradient Fill (default enabled).
Frequently Asked Questions

Original indicatorBuilt in-house by LuxAlgo
The Library is free. Quant makes it yours.
Pull any concept or indicator into Quant: rebuild it, retune it, or turn it into a backtested strategy of your own.