Yang-Zhang Estimator
 By LuxAlgoJun 5, 2026
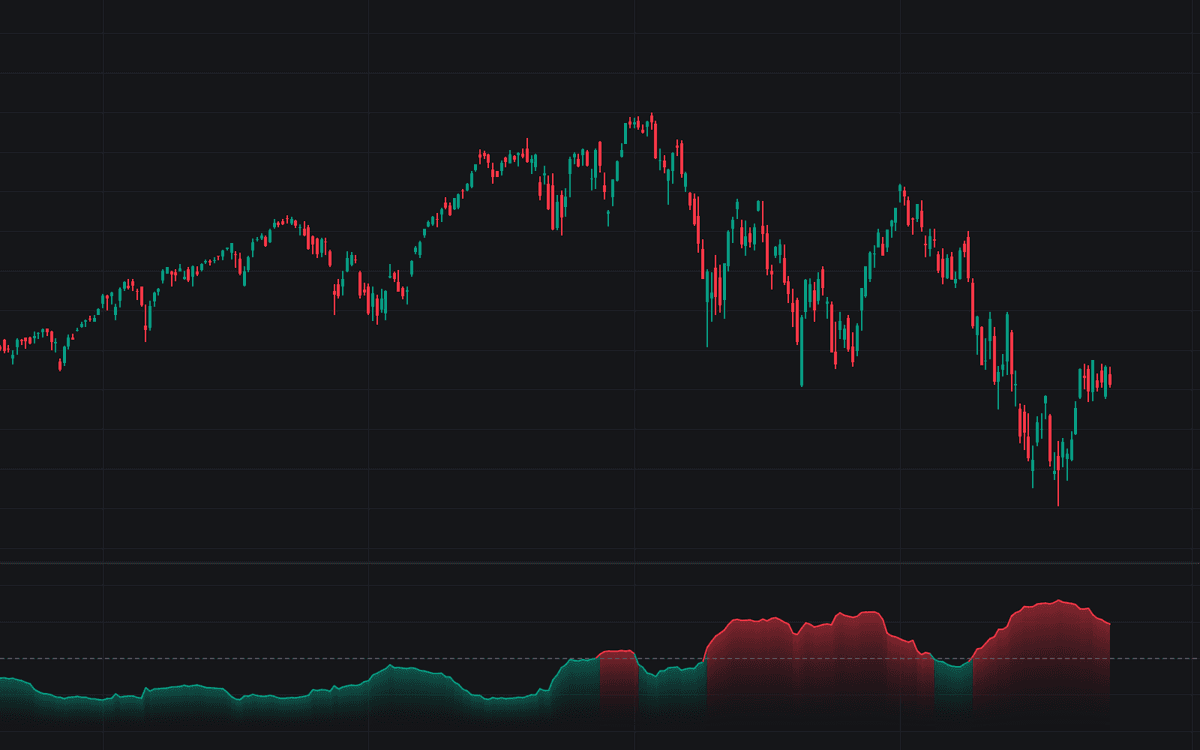

Yang-Zhang Estimator is the definitive clean build of the Yang-Zhang estimator, the OHLC realized-volatility measure that handles opening gaps and drift at once. Overnight and open-to-close log returns feed two sample variances over the window, a Rogers-Satchell range term supplies the third component, and the three combine under the paper's weight k = 0.34 / (1.34 + (n + 1) / (n - 1)) and annualize into a percentage. The line draws with a gradient fill, a dashed threshold marks your reference level, and a slower comparison estimate can overlay for regime work.
How to Trade the Yang-Zhang Estimator?
- Threshold crosses: the estimate crossing above the Threshold Level marks entry into your defined high-volatility regime; crossing back below marks normalization.
- Expansion / contraction: the primary estimate crossing above the slower comparison estimate signals volatility expanding; crossing below, contracting.
- Component read: the optional component plots show where the volatility lives. On 24/7 markets the overnight term sits near zero.
It is a sizing and regime instrument, not a directional signal.
Yang-Zhang Estimator Settings
- Window Length (default 20): bars n in the estimation window; shorter tracks regime shifts faster but jumps more.
- Bars per Year (default 252): annualization factor, matched to the symbol's clock.
- Show Comparison Window (default off) and Comparison Length (default 60): the second, slower estimate behind the expansion/contraction alerts.
- Show Threshold (default on) and Threshold Level (%) (default 20): the dashed reference line and its level.
- Show Components (default off): plots the annualized overnight, open-to-close and Rogers-Satchell components separately.
Frequently Asked Questions

The Library is free. Quant makes it yours.
Pull any concept or indicator into Quant: rebuild it, retune it, or turn it into a backtested strategy of your own.