Concept
Rogers-Satchell Estimator
Rogers-Satchell Estimator is a Volatility concept. The Library holds 1 implementation, a working definition you can pull into Quant.
drift-independent
Top Rogers-Satchell Estimator indicator
The top custom implementation, built on the original standard Rogers-Satchell Estimator formula.
1 total
Want to trade Rogers-Satchell Estimator? The implementation below is one prompt away from a backtested strategy in Quant.
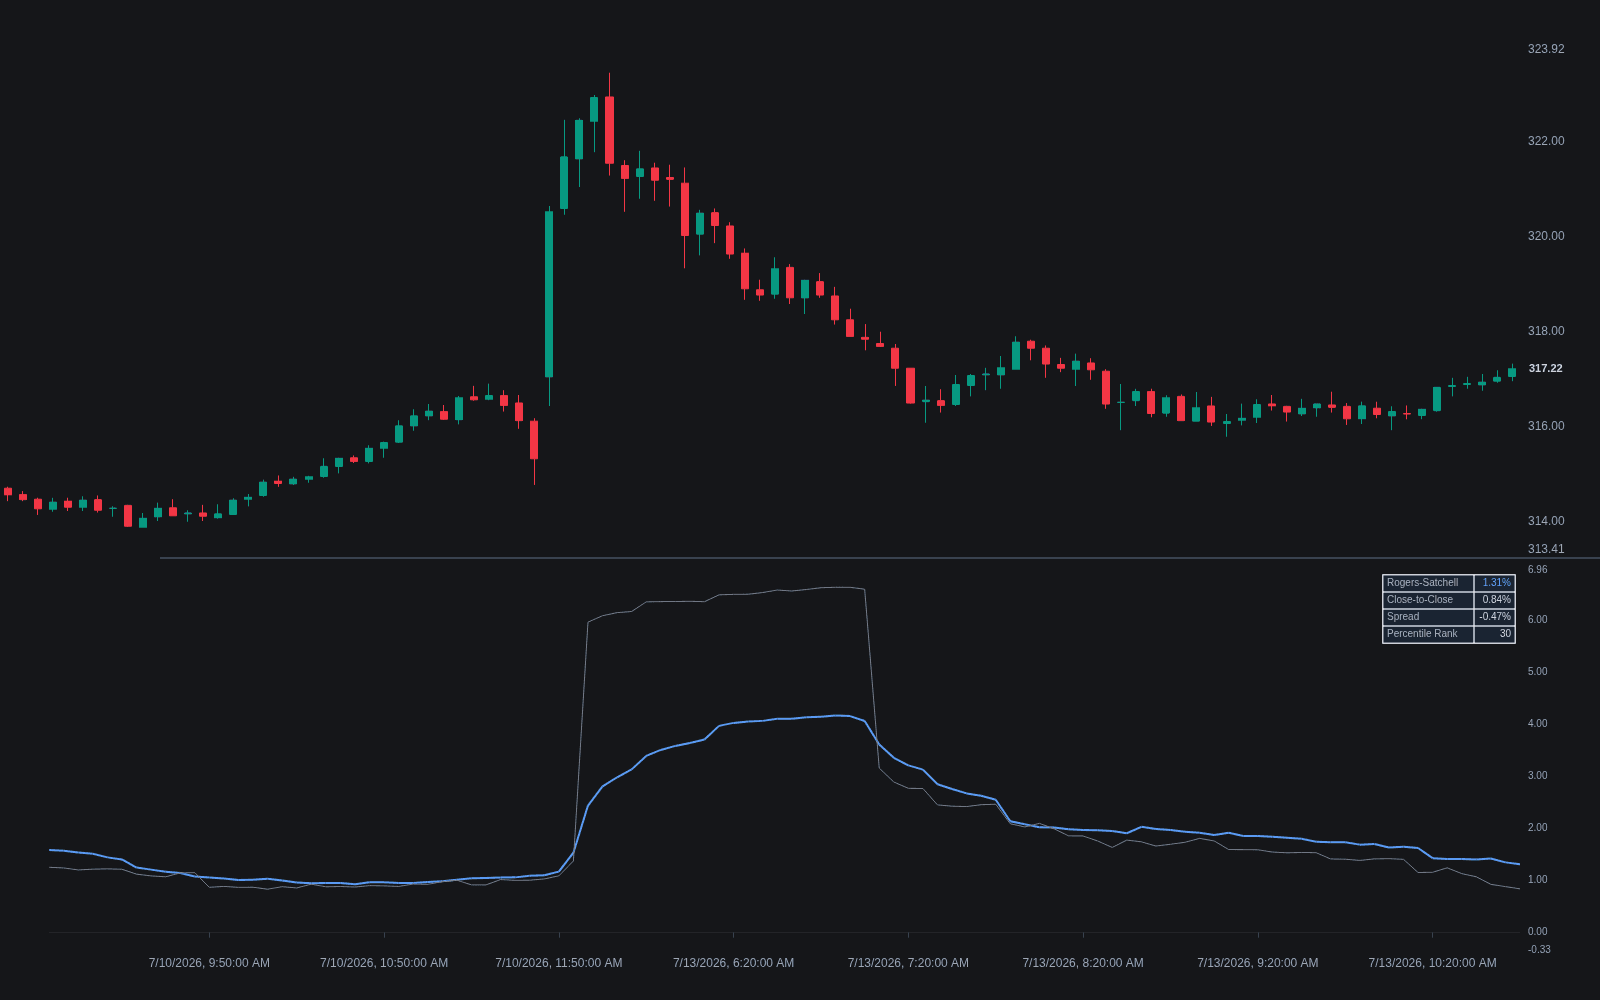
What is the Rogers-Satchell Estimator?
The Rogers-Satchell estimator is an OHLC volatility estimator whose defining property is drift independence: it stays unbiased when the market trends, where earlier range-based estimators assume a zero mean return. Introduced by L.C.G. Rogers and S.E. Satchell in 1991, the per-bar variance is the log of high over close times the log of high over open, plus the log of low over close times the log of low over open. Pairing each extreme against both endpoints is what cancels drift: a bar that opens at its low and closes at its high contributes exactly zero, while two-sided excursion contributes a lot.
Like the Parkinson estimator and Garman-Klass estimator, it sees only what happens inside the bar, so overnight gaps are invisible and gap-prone assets are understated. Its main modern role is as the intraday core of the Yang-Zhang estimator, which wraps overnight and open-to-close variance terms around it to handle gaps and drift at once.
The zero-contribution case is the estimator's soul, not a bug: a bar that opens on its low and closes on its high traveled far but wiggled not at all, and Rogers-Satchell prices exactly the wiggle. That is what drift independence means operationally, the estimator measures excursion around the bar's path rather than the path's progress, so a clean trend day reads as quiet and a violent two-sided day reads as loud, whatever the net change. Aggregation follows the family convention: average the per-bar variances over a window, take the square root, annualize by the period count, and the range-based construction delivers several times the statistical efficiency of close-to-close estimates on the same data.
Practice deploys it in three roles. Standalone, it feeds volatility bands and vol-targeted sizing in trending regimes, where zero-drift estimators quietly inflate; diagnostically, the spread between Rogers-Satchell and Parkinson or Garman-Klass over one window decomposes measured volatility into wiggle versus one-way drift, a regime read in itself, the comparison estimator-suite tools exist to display; and structurally, it is the intraday engine inside Yang-Zhang, the composite most desks reach for when gaps and drift both matter. Its boundary is the bar: anything that happens between sessions is invisible to it by construction.
How to calculate the Rogers-Satchell estimator
Two log products per bar, averaged and annualized: the drift cancellation is baked into the pairing.
- 1Per bar, compute the first product: the log of high over close, times the log of high over open.
- 2Add the second: the log of low over close, times the log of low over open; the sum is the bar's variance contribution.
- 3Average the contributions across the estimation window to get per-period variance.
- 4Take the square root and annualize by the number of periods per year for a comparable volatility figure.
- 5Diagnose drift by comparison: the gap between this estimate and a zero-drift range estimator over the same window measures how much of apparent volatility was actually trend.
How it's calculated
A range-based volatility estimator built from each bar's open, high, low, and close that remains unbiased when price drifts.
Unlike the Parkinson and Garman-Klass estimators, its expectation is unaffected by a nonzero drift, so it stays valid in trending markets.
All four inputs sit inside one bar, so overnight gaps are ignored; the Yang-Zhang estimator combines Rogers-Satchell with an overnight term to cover them.
Each RS_t is non-negative by construction; quote sigma_t per bar and apply sqrt(A) only when an annualized figure is needed.
How traders use it
- As the within-bar volatility estimate for trending markets: zero-drift estimators inflate when the tape runs one way, while Rogers-Satchell prices only the wiggle around the move.
- As a drift diagnostic: a wide gap between Parkinson or Garman-Klass and Rogers-Satchell over the same window flags how much of measured 'volatility' is actually one-way trend.
- As a band and stop input where trend is the norm: envelopes sized from it reflect two-sided excursion rather than directional progress, so they do not balloon simply because the market is running.
- Inside the Yang-Zhang composite: as the drift-proof intraday core around which the overnight and open-to-close terms are wrapped, which is how most institutional realized-vol figures consume it.
- In estimator-suite dashboards: plotted beside Parkinson, Garman-Klass and close-to-close measures so their agreements and spreads read as a live decomposition of what kind of volatility the market is currently producing.
Rogers-Satchell vs related OHLC estimators
Parkinson Estimator: Parkinson uses only the high-low range and assumes zero drift, so trend days inflate its reading; Rogers-Satchell pairs the extremes against both endpoints and cancels the drift term. In a strong trend the two diverge, and the divergence itself is the drift measurement.
Garman-Klass Estimator: Garman-Klass adds open and close information to Parkinson for better efficiency but keeps the zero-drift assumption; Rogers-Satchell trades a little efficiency for unbiasedness under trend. Quiet rangebound tape favors Garman-Klass, running tape favors Rogers-Satchell.
Yang-Zhang Estimator: The composite completion: Yang-Zhang wraps an overnight variance term and an open-to-close term around the Rogers-Satchell core, handling gaps and drift simultaneously. Where gaps matter, Yang-Zhang is the deployment and Rogers-Satchell the engine inside it.
Concept family
Volatility
57 concepts mapped · 57 in the Library
Rogers-Satchell Estimator FAQ
Turn Rogers-Satchell Estimator into a trading strategy.
Take the implementation from this page into Quant, then build on it, backtest it on real data, and keep refining it in conversation.